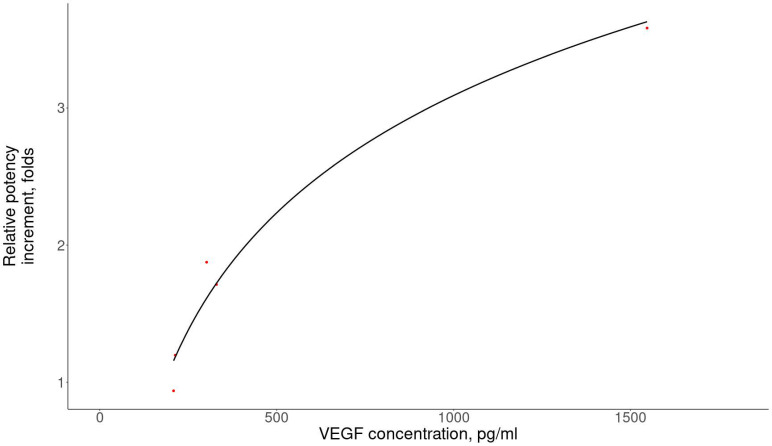
Figure 2.
The VEGF concentration in the MSC secretome was directly associated with the potency increment (testosterone secretion) compared to cells from the control group (R = 0.9, p = 0.083, Spearman’s test). The Y axis represents the ratio of the testosterone concentration after MSC secretome treatment to the testosterone concentration in the control without the MSC secretome. The correlation was calculated using Spearman’s test. Red dots indicate independent samples.

