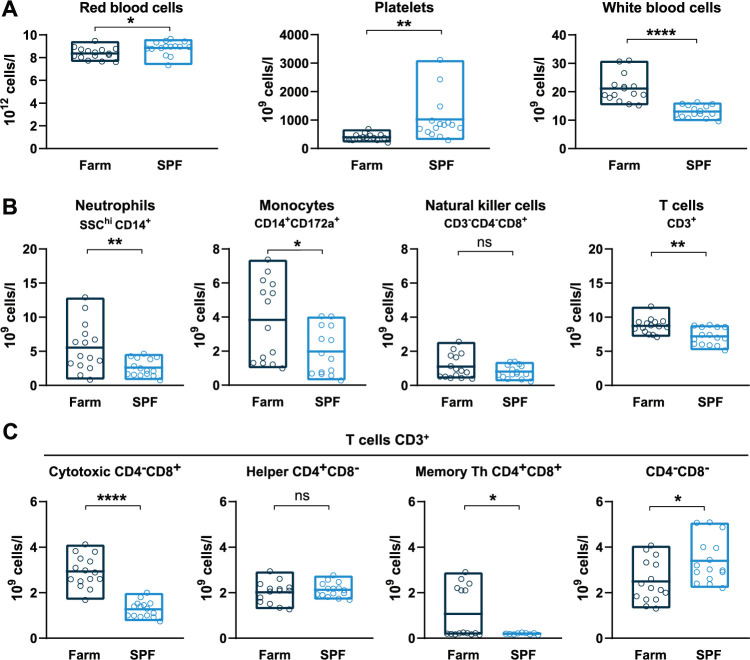
Fig 1. Basal hematologic and immune profiles of SPF and farm pigs.
(A) RBC, PLT, and WBC counts in uninfected pigs. (B) Immunophenotyping of blood leukocytes (CD45+). The percentage of each subset was determined by flow cytometry gating (S2 Fig) and the absolute numbers were calculated using WBC counts. (C) T cell subsets gated from CD3+ T cells. (A, B, C) Each point represents the value for a single pig, horizontal lines and boxes represent the mean and range. Data are from 2 independent experiments (n = 15 per SPF or farm groups) and were analyzed using unpaired t test; ns, not significant; * p<0.05; ** p<0.01; **** p<0.0001.

