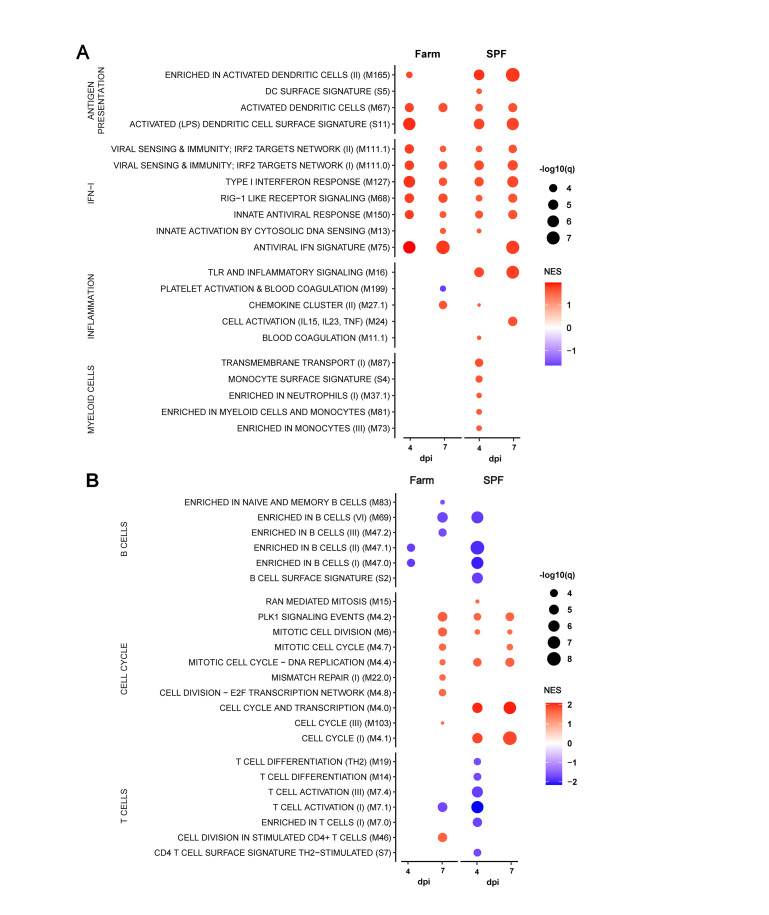
Fig 6. BTM analysis after infection with virulent ASFV Armenia 2008.
Data shows only the significantly different (A) innate and (B) adaptive immune cell BTMs in farm and SPF pigs at 4 and 7 dpi relative to their respective BTM at baseline (day 0). BTM modulations were calculated as normalized enrichment scores (NES) using GSEA. Increased (red) or decreased (blue) BTMs are shown relative to each group’s respective baseline with color intensity proportional to the NES and the size of the data points proportional to the q value. Data is from n = 6/group, except for 7dpi where n = 3 for SPF group.

