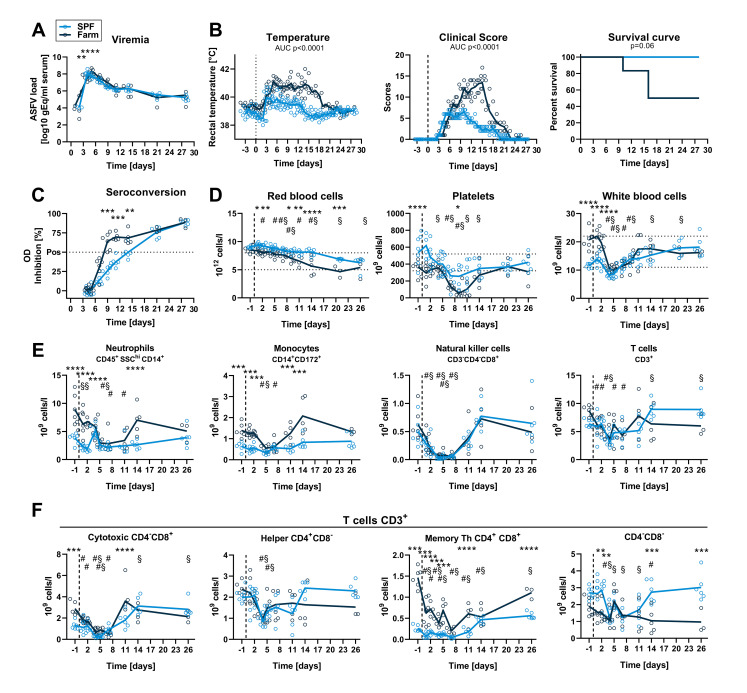
Fig 7. Virus load, clinical signs, and blood cell profiles after infection with attenuated ASFV strain Estonia 2014.
SPF and farm pigs were inoculated intramuscularly with ASFV Estonia 2014 and blood samples were taken 1 day before infection and 1, 2, 4, 5, 7, 11, 14 and 26 dpi. All surviving animals were euthanized on 28 dpi. (A) Viremia was determined in serum by qPCR. (B) Rectal temperature, clinical score, and survival were reported daily. (C) Seroconversion was tested by ELISA. (D) RBC, PLT, and WBC counts in blood at indicated dpi. (E) Immunophenotyping of blood leukocytes (CD45+). Percentage of each subset was determined by flow cytometry gating (S2 Fig) and absolute numbers were calculated using WBC counts. (F) T cell subsets were gated from CD3+ T cells. (A-F) Data points represent values for individual pigs, lines indicate the mean of each group. Data are from a single experiment (n = 6 pigs/group, except from 11 dpi (n = 5) and from 15 dpi (n = 3) for farm group). (A, C-F) Differences between SPF and farm groups were analyzed by unpaired t test at each dpi with Holm-Sidak’s correction for multiple comparisons. * p<0.05; ** p<0.01; *** p<0.001; **** p<0.0001. (B) Differences between groups for body temperature and clinical scores were analyzed by comparing the area under the curve (AUC). Differences in survival were analyzed by Log-rank (Mantel-Cox) analysis. (D, F) Significant differences in blood cell subsets at different dpi compared to the respective baseline (-1 dpi) are indicated for SPF (§, p<0.05) and farm (#, p<0.05); data were analyzed using mixed model analysis followed by Dunnett’s multiple comparison.

