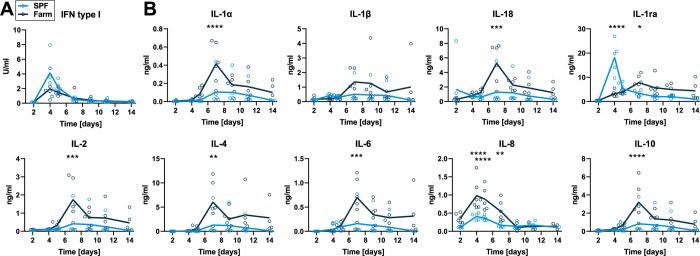
Fig 8. Serum cytokines after infection with attenuated ASFV Estonia 2014.
Blood samples were taken on 2, 4, 5, 7, 9, 11, and 14 dpi. (A) IFN type I activity in serum was measured by bioassay. (B) Cytokine levels were determined by multiplex ELISA. Data points show values for individual animals and lines indicate mean of each group at indicated dpi. Differences between SPF and farm groups were analyzed by unpaired t test at each dpi with Holm-Sidak’s correction for multiple comparisons (n = 6 pigs/group, except on 14 dpi, where n = 5 for farm group). * p<0.05, ** p<0.01, *** p<0.001, **** p<0.0001.

