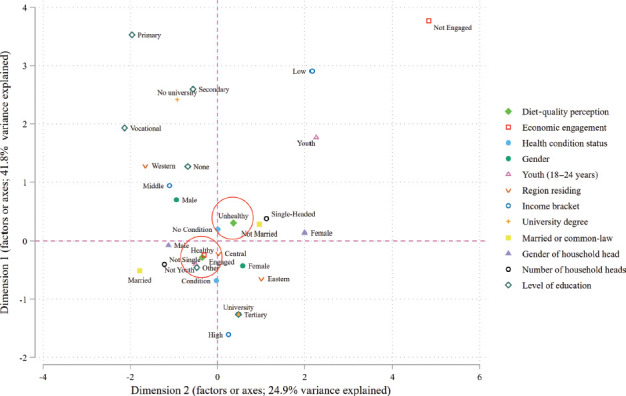
FIGURE 1. Multiple correspondence analysis plot of sociodemographic variables and outcome variables for survey respondents in Jamaica, 2020.

Source: Figure prepared by authors from the study results.
Note: The figure is a map of the variables plotted in a 2-dimensional geometric space. In this context, Dimensions 1 and 2 are similar in interpretation to the y- and x-axes. They can also represent a particular feature or factor as determined by the variables contained therein. Variables clustered in the same quadrant indicate that there is an association among them. Circles indicate the location of alternate values of the diet-quality perception variable.
