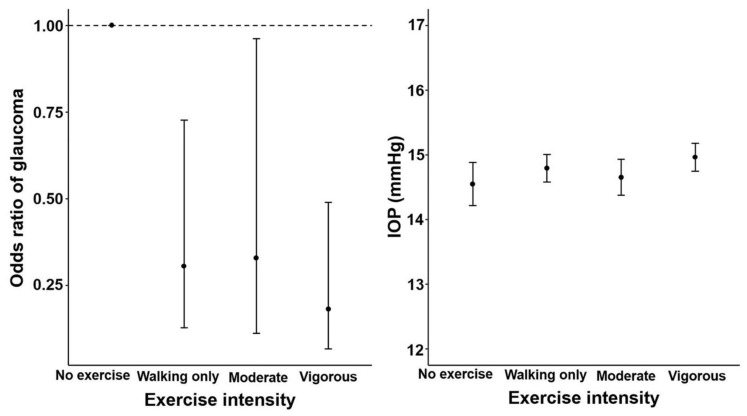
Figure 2.
Odds ratios for glaucoma and mean IOP according to the intensity of exercise in men aged ≥40 years. Trend p using a logistic and linear regression model after adjusting for age, body mass index, smoking, drinking, monthly income, total energy intake, caffeine intake, hypertension diabetes mellitus, spherical equivalents. For odds of glaucoma, model 5 was used and for IOP, model 4 was used. Error bars indicate 95% confidence intervals. IOP, intraocular pressure.

