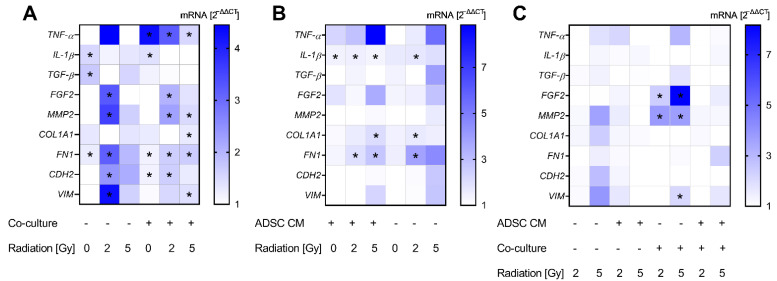
Figure 4.
Alterations in gene expression profiles at the mRNA level in MCF-10A cells. The heatmaps show mean relative mRNA expression in MCF-10A cells compared to GAPDH/YWHAZ and to the corresponding control group, n = 3 replicate experiments. (A) Shows the effect of treatment with conditioned medium (CM) of adipose-derived stem cells (ADSC) normalized to treatment with control CM. (B) Presents the effect of co-cultivation with fibroblasts normalized to monocultures. The effect of irradiation is demonstrated in (C), whereby irradiation with 2 Gy and 5 Gy is normalized to 0 Gy. Values were calculated using the 2−ΔΔCT method, 2−ΔΔCT of control = 1. White fields: 2−ΔΔCT < 1; * p < 0.05, increased compared to the corresponding control (Mann–Whitney U-test). TNF-α: tumor necrosis factor alpha, IL-1β: interleukin-1β, TGF-β: transforming growth factor-β, FGF2: fibroblast growth factor-2, MMP2: matrix metallopeptidase 2, COL1A1: collagen type I alpha 1 chain, FN1: fibronectin 1, CDH2: cadherin-2/N-cadherin, VIM: vimentin.

