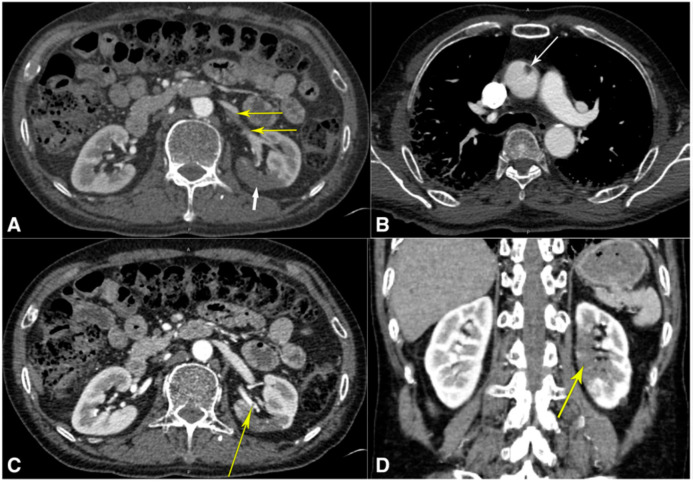
Figure 8.
Tomography computed using angiography: (A) abdominal computed tomography angiography (CTA), demonstrating thrombi in the left superior renal artery (thin yellow arrows) and infarcts in the posterior mid-pole of the left kidney (thick white arrow); (B) CTA of the thorax, demonstrating ascending aortic thrombus (arrow); (C) abdominal CTA displaying a different perspective of the left superior renal artery thrombus (yellow arrow); (D) computed tomography abdominal angiography in coronal projection, demonstrating the extent of the left renal infarction (yellow arrow). This image is presented in color at www.ajmh.org (accessed on 28 March 2020). Mukherjee et al. [121].

