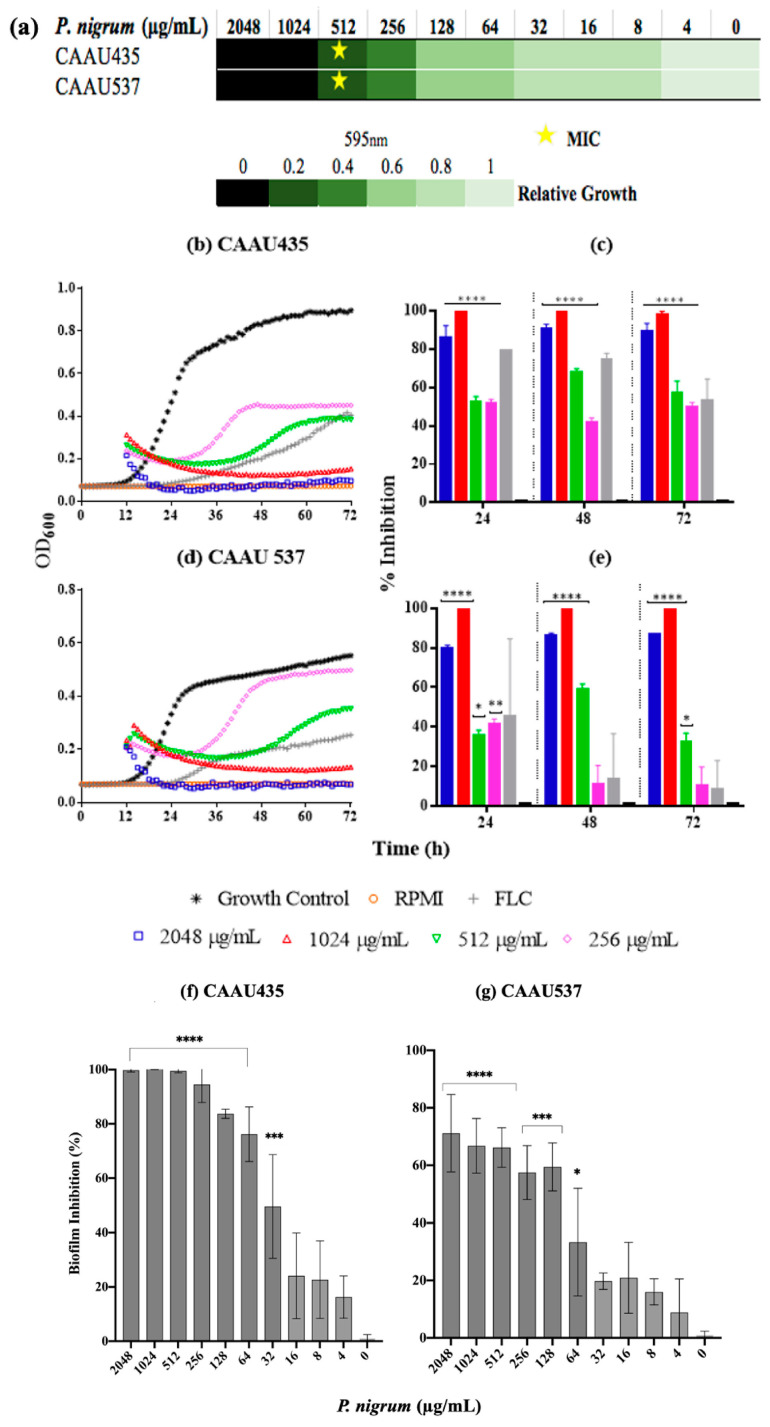
Figure 9.
Anticandidal activity of P nigrum on C. auris. (a) P nigrum MICs (indicated by stars), the green bars indicate relative fold growth. (b,d) Killing kinetics curves (c,e) percentage of growth inhibition. (f,g) inhibitory activity against biofilm development. Control bar indicates untreated cells, accepted as 0% inhibition (0 μg/mL). p-values of <0.05 were used to indicate statistical significance as follows: * p ≤ 0.05. ** p ≤ 0.01. *** p ≤ 0.001. **** p ≤ 0.0001.

