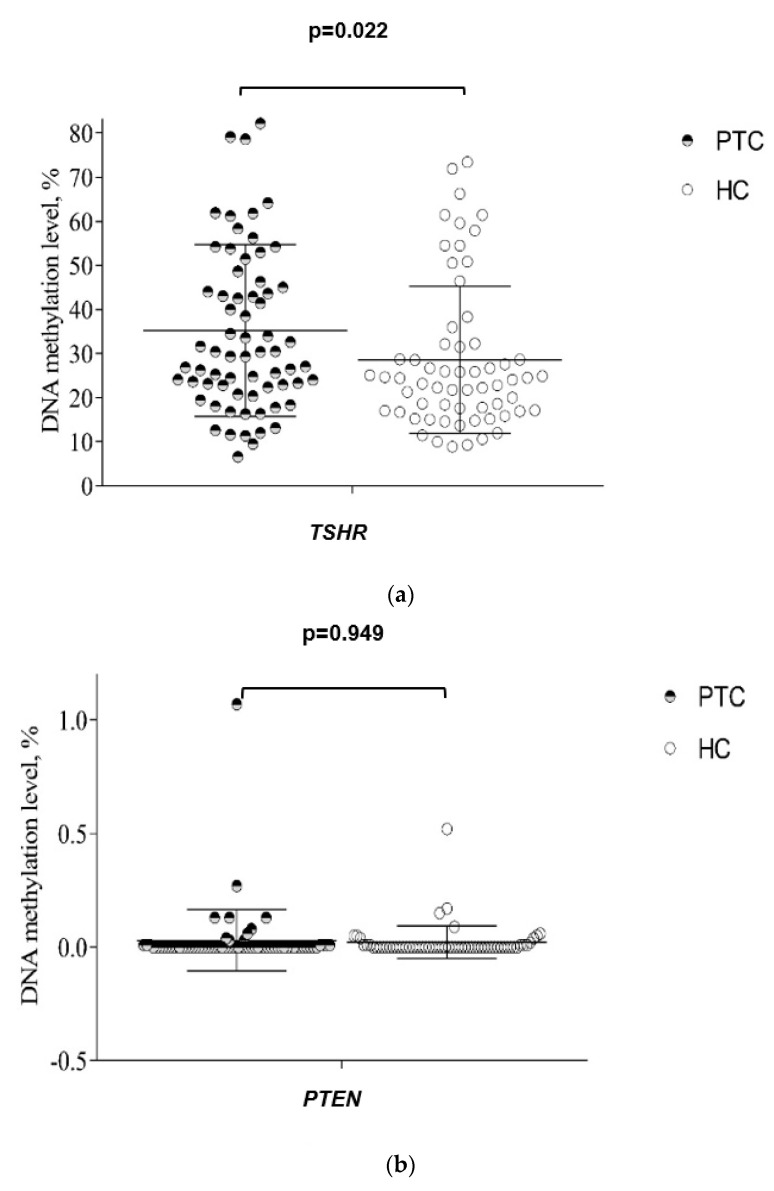
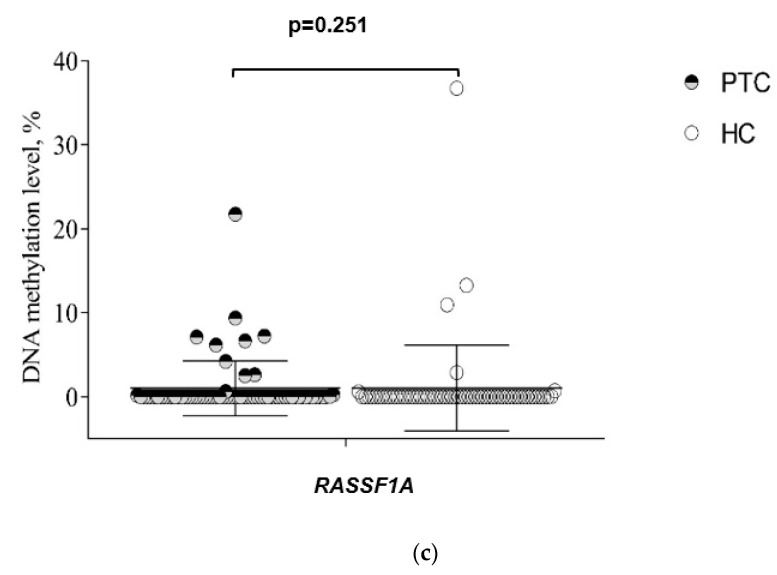
Figure 2.
(a) The comparison of TSHR methylation level in papillary thyroid cancer (PTC) and healthy control (HC) patients. Analysis of the Mann–Whitney U test criterion was used to determine the differences in quantitative traits between the comparison groups. Data are expressed in whiskers plot for mean and standard deviation (SD). (b) The comparison of PTEN methylation level in papillary thyroid cancer (PTC) and healthy control (HC) patients. Analysis of the Mann–Whitney U test criterion was used to determine the differences in quantitative traits between the comparison groups. Data are expressed in whisker plots for mean and standard deviation (SD). (c) The comparison of RASSF1A methylation level in papillary thyroid cancer (PTC) and healthy control (HC) patients. Analysis of the Mann–Whitney U test criterion was used to determine the differences in quantitative traits between the comparison groups. Data are expressed in whiskers plot for mean and standard deviation (SD).


