
Figure 4.
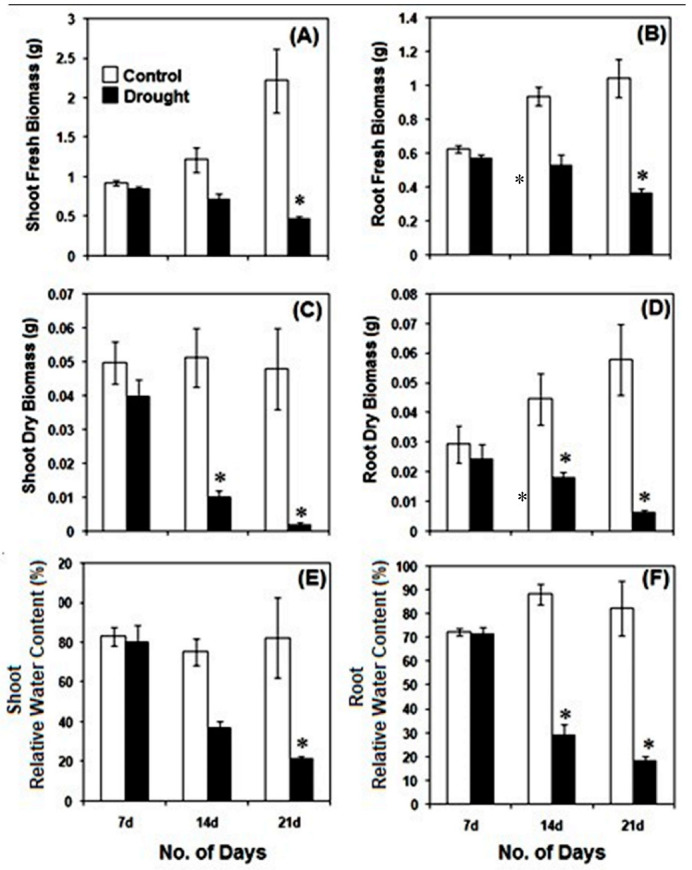
Drought-induced changes in fresh biomass (A,B), dry biomass (C,D) and relative water content (E,F) in pearl millet seedlings after 7, 14 and 21 days of treatment. The data presented are the mean of three replicates (n = 3), ±Standard Error (SE). Asterisks (*) represent the significant difference at p ≤ 0.01 with respect to the controls. Note: 7d, 14d and 21d indicate 7, 14 and 21 days.