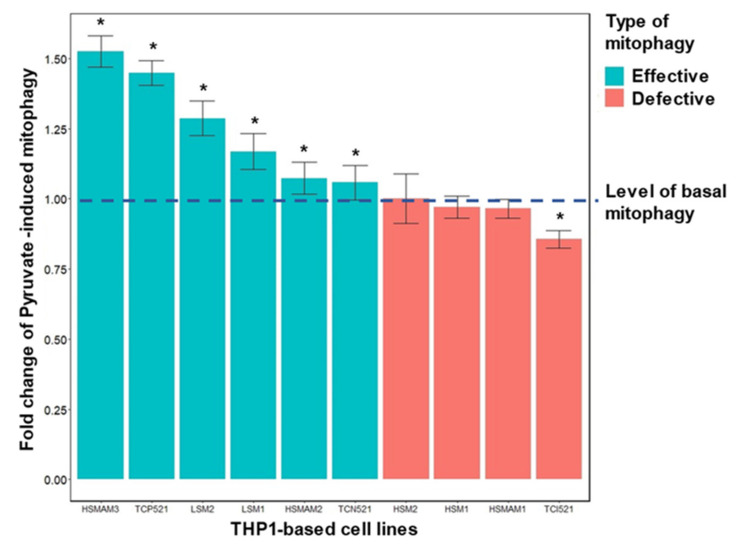
Figure 8.
Induction of mitophagy with pyruvate in cybrid lines carrying atherosclerosis-associated mtDNA mutations. Shown is the change in mitophagy under the influence of pyruvate relative to the basal level of mitophagy in ten cybrid lines. The experiment procedure was the same as given in the description of Figure 7 with exception of using of sodium pyruvate (20 mM) for colocalization stimulation. The basal level of mitophagy was taken as one and marked with a dotted line. Cybrid lines with efficient mitophagy, i.e., with increased intensity of mitophagy under the influence of pyruvate, are represented in green. Cybrid lines with defective mitophagy, i.e., either not different from the basal level or below the basal level, are marked in red. An asterisk indicates significant differences between induced mitophagy and basal mitophagy, p < 0.05, according to the results of the Wilcoxon non-parametric paired test [31].

