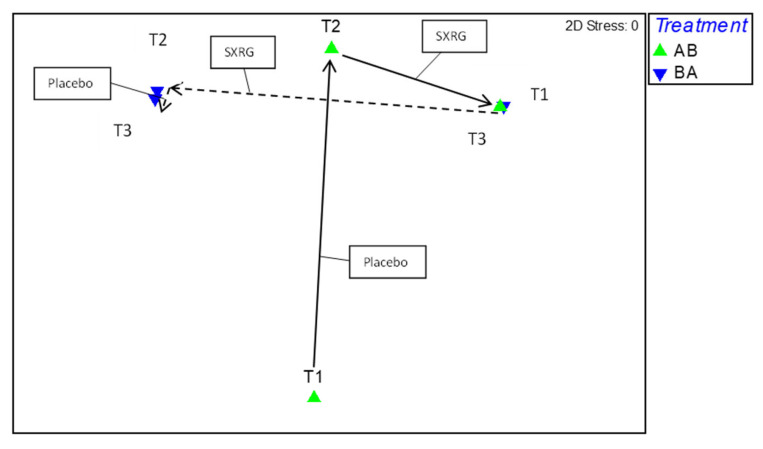
Figure 6.
Correlation plot of gut microbiome movement per treatment group. Green triangles are regime AB (starting on placebo then crossing to SXRG84 treatment), blue triangles are regime BA (starting on SXRG84 treatment then crossing to placebo). T1 is baseline measure, T2 is measure from six weeks, and T3 is measure from 12 weeks.

