
Fig. 1.
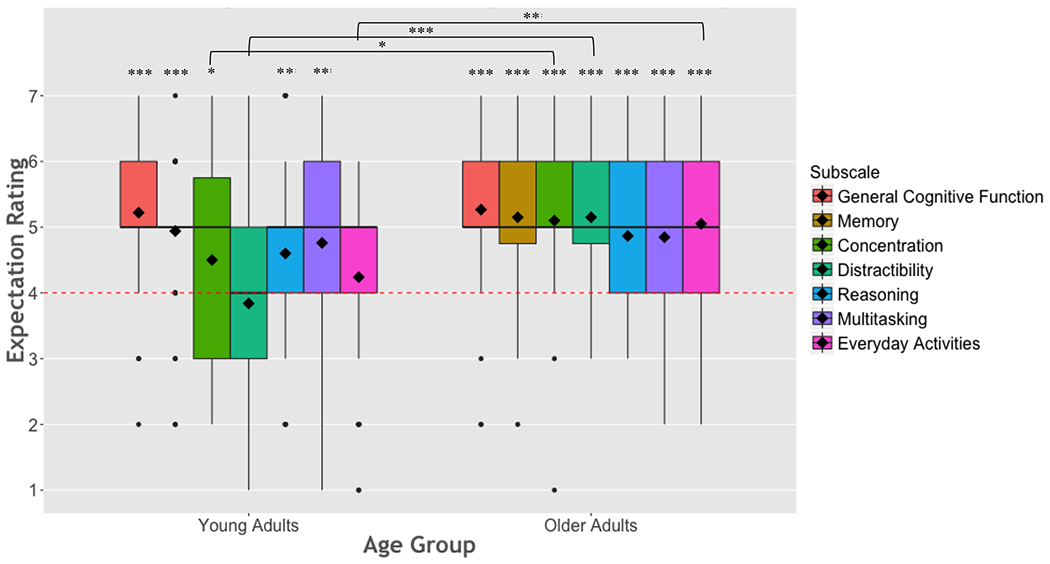
Expectation ratings in young and older adults at baseline. Whereas ratings generally varied between 4 and 5 in young adults, the distribution of responses surrounded 5 / “somewhat successful” in older adults. Dashed line indicates the neutral point (score of 4) on the survey scale. Dashed lines are drawn across the neutral point (rating of 4). Bold lines represent the group medians; diamonds represent the group means. *p < .05. **p < .01. ***p < .001.