
Fig. 2.
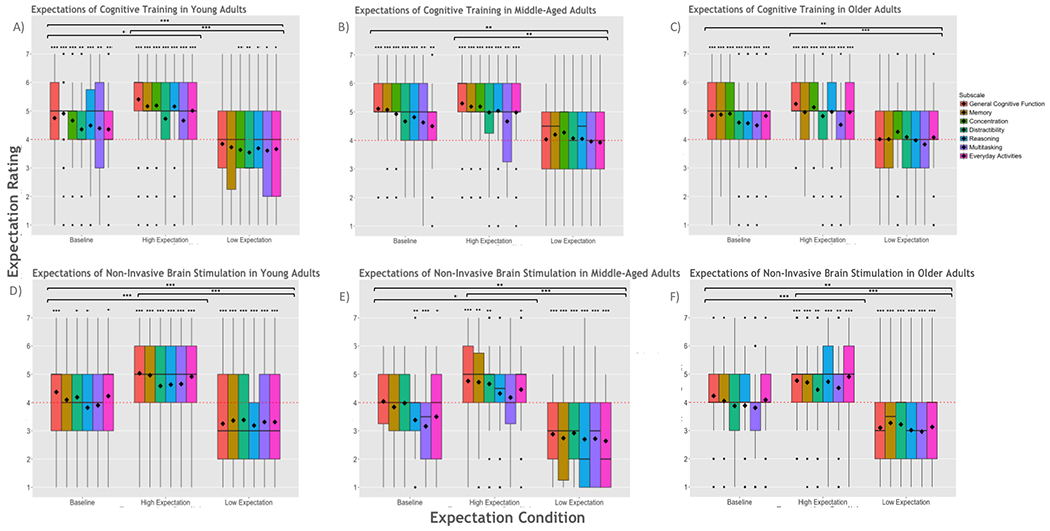
Expectations of computerized cognitive training and non-invasive brain stimulation across conditions in (A,D) young (B,E) middle-aged and (C,F) older adults. Expectation ratings consistently increase relative to baseline in the High Expectation condition and decrease relative to baseline in the Low Expectation condition. Dashed lines are drawn across the neutral point (rating of 4). Bold lines represent the group medians; diamonds represent the group means. *p < .05. **p < .01. ***p < .001.