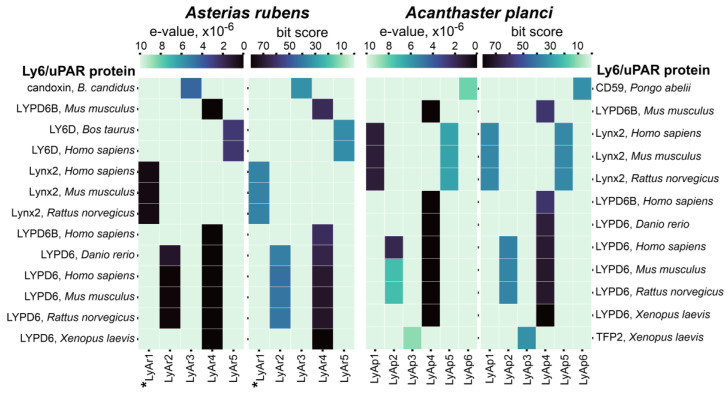
Figure 1.
E-value and bit score heatmaps for putative TFPs from A. rubens and A. planci predicted by BLAST search vs. closest Ly6/uPAR proteins. Darker cells correspond to higher bit-scores and lower e-values of blast hit. The sequence of LyAr1 from A. rubens studied in this work (Lystar5) is designated by asterisk. Correspondence of putative TFPs from starfishes to the transcript IDs in the NCBI database is given in Table S2.

