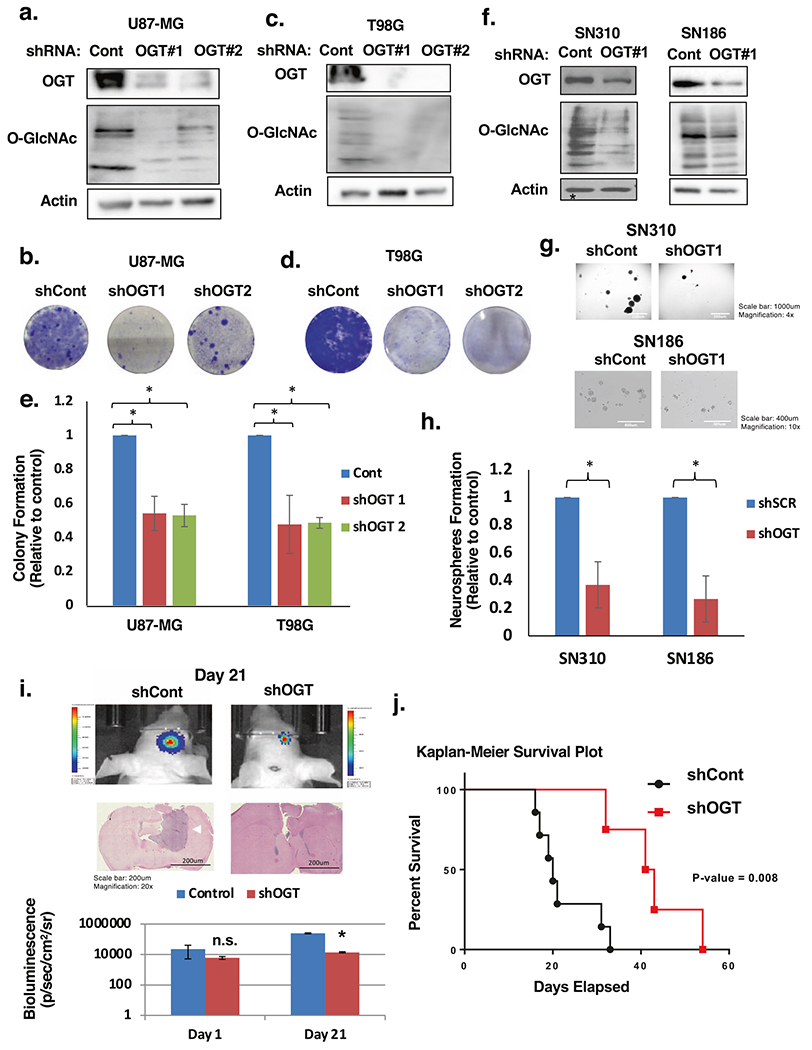
Fig. 2. OGT is required for glioblastoma growth in vitro and in vivo.

a Cell lysates from U87-MG cells expressing control or OGT shRNA were collected for immunoblot analysis with the indicated antibodies. b U87-MG cells infected with shControl or shOGT lentivirus effect on cell growth visualized with crystal violet staining. c Cell lysates from T98G cells expressing control or OGT shRNA were collected for immunoblot analysis with the indicated antibodies. d T98G cells infected with shControl or shOGT lentivirus effect on cell growth visualized with crystal violet staining. e Anchorage-independent growth assay comparing the colony formation of control or OGT shRNA expressing in indicated cells. Data are quantified and presented as average relative to control from three independent experiments. Student’s t-test reported as mean ± SD; *p < 0.05. f Cell lysates from SN310 (left) or SN186 (right) primary GBM cells expressing control or OGT shRNA were collected for immunoblot analysis with the indicated antibodies. g Cells from f were then plated for a neurosphere formation assay for 8 days and representative image taken. h Neurospheres were quantified for SN310 and SN186 cells and presented as average relative to control from three independent experiments. Student’s t-test reported as mean ± SD. *p-value < 0.05. i Representative images of bioluminescent (top) detection of tumors from mice injected with shControl and shOGT U87-MG cells 21 days post-injection. Representative images of H&E analysis (middle) on coronal sections from mice harboring shControl or shOGT tumors at Day 21. White arrow pointing to control tumor. Data are quantified and presented as average from mice injected with U87-MG cells expressing shControl (n = 5) or shOGT mice (n = 7). (bottom). Student’s t-test reported as mean ± SD; *p < 0.005. j Kaplan–Meier survival plot comparing overall survival of mice inoculated with shControl (n = 7) or shOGT (n = 4) U87-MG cells. Mantel–Cox log rank test P = 0.008.
