
Extended Data Fig. 1 |. Phenotyping hypokalemic mice.
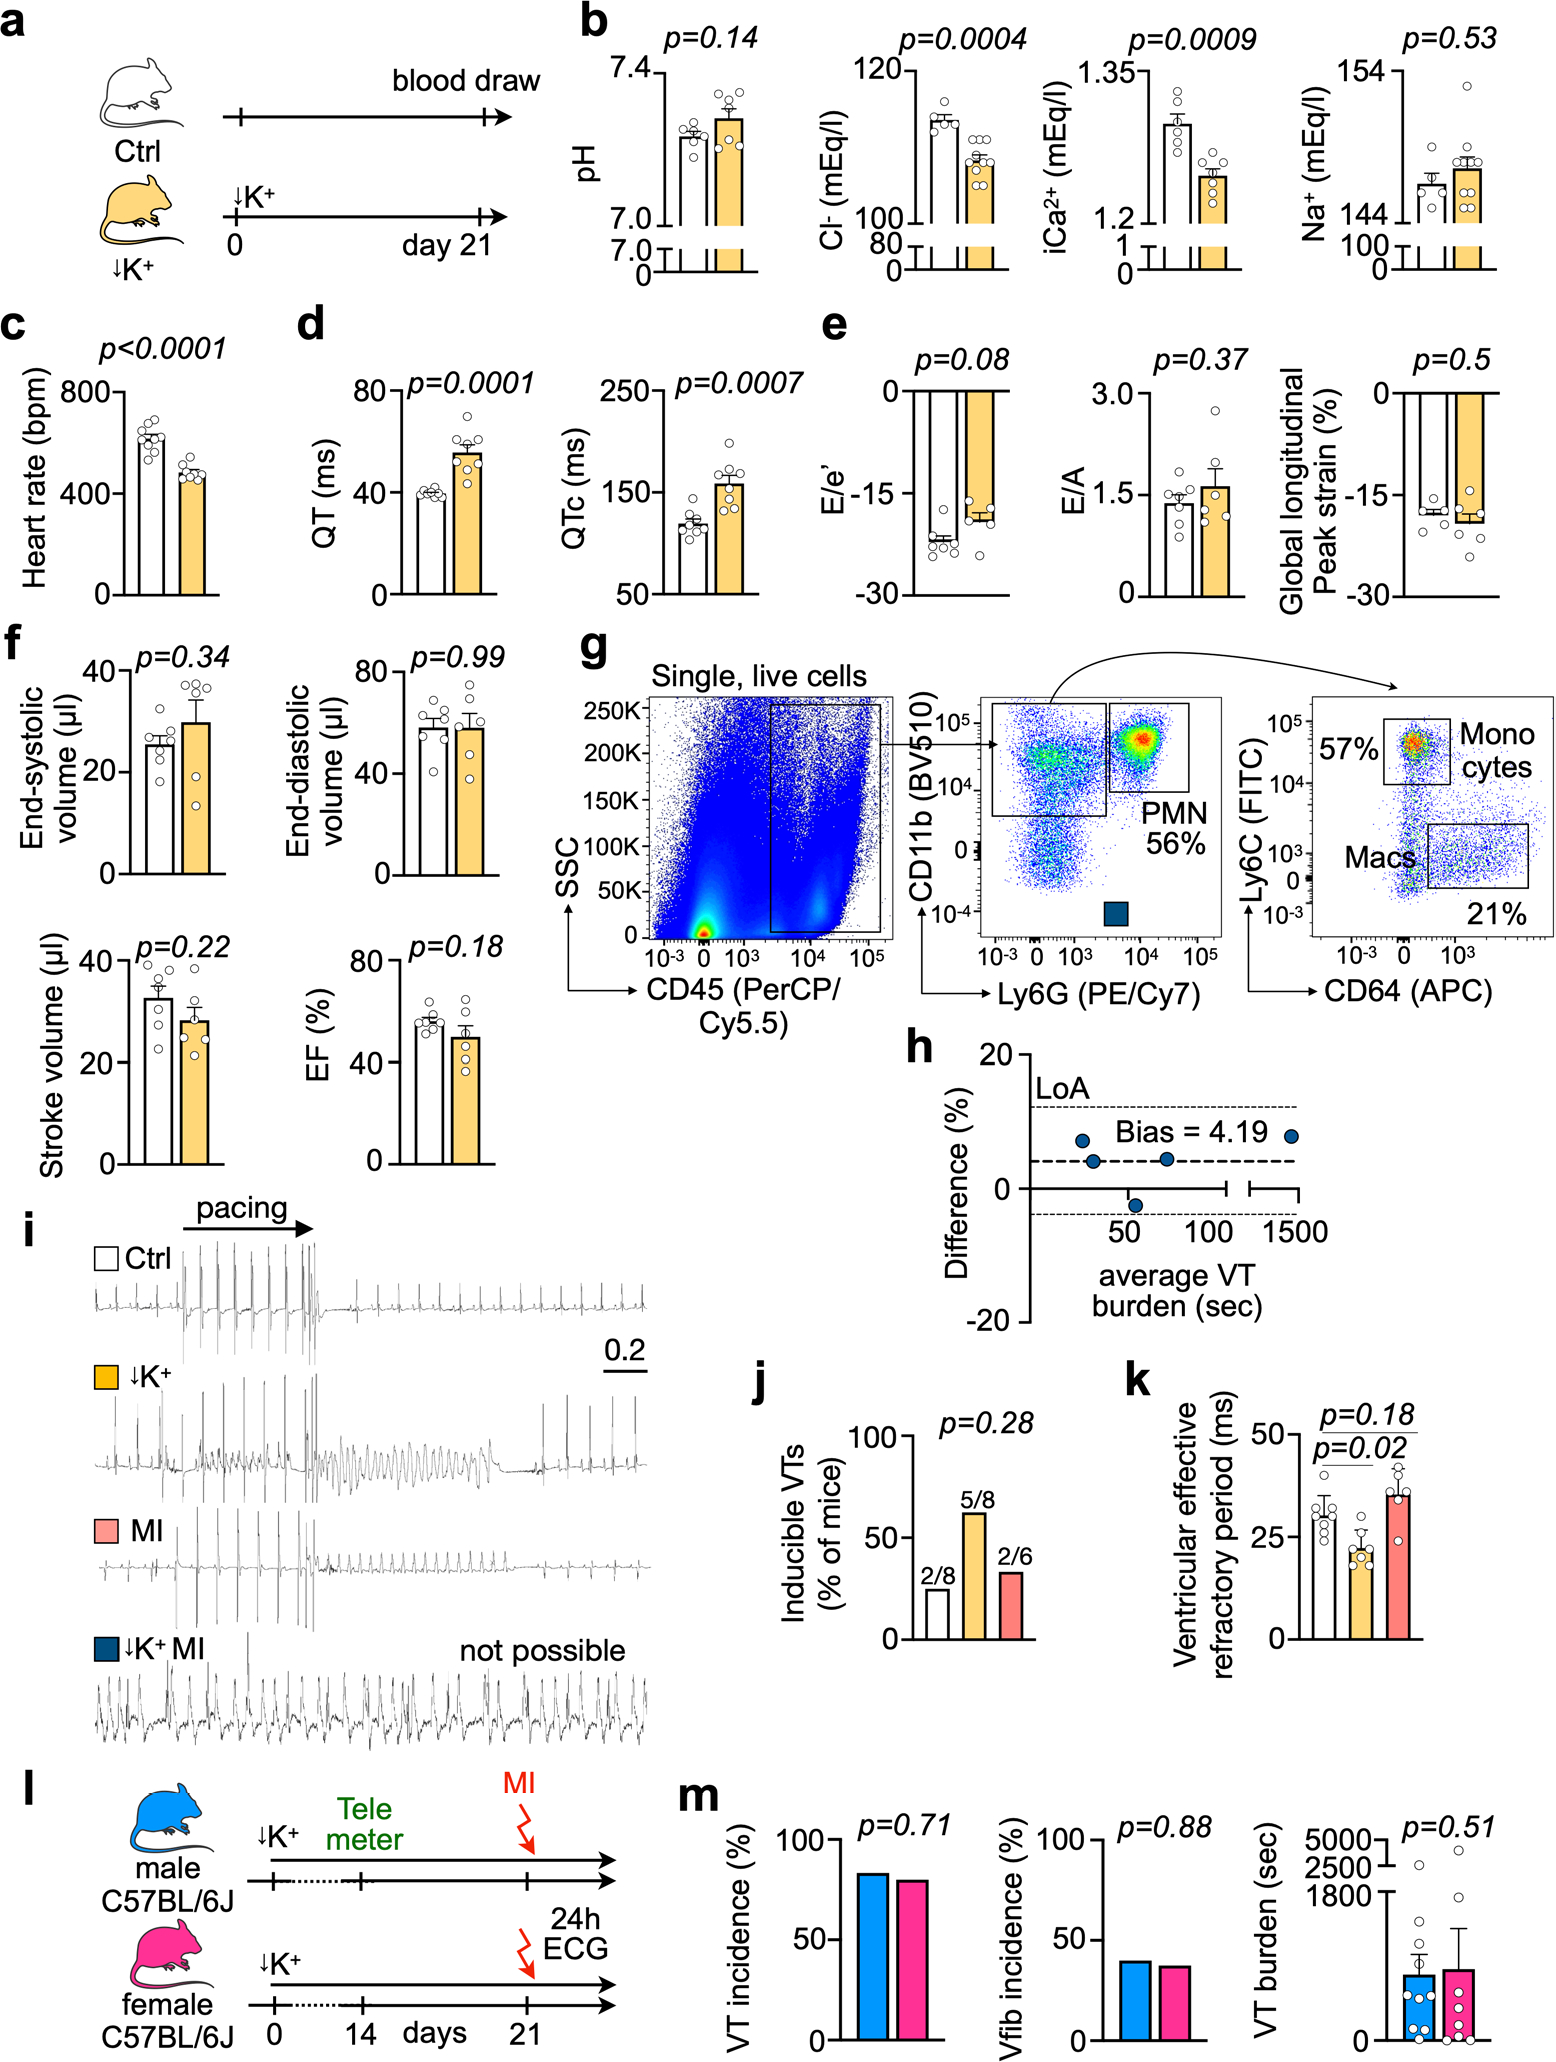
a, Experimental outline. b, pH, Cl−, iCa2+ and Na+ measured in normokalemic (n = 5 or n = 6 mice) and hypokalemic mice (n = 7 or n = 10). Two-sided unpaired t tests were used. c, Average heart rate by telemetric ECG recordings in ambulatory normokalemic (n = 9 mice) and hypokalemic mice (n = 8). Two-sided unpaired t tests were used. d, QT and QTc intervals in normokalemic (n = 8 mice) and hypokalemic mice (n = 8). Two-sided unpaired t tests were used. e, Diastolic function measured by echocardiography in normokalemic (n = 7 mice) and hypokalemic (n = 5 or n = 6) mice indicated by the ratio between mitral inflow velocity and mitral valve annular early diastolic velocity (E/e′), late diastolic trans-mitral flow velocity (E/A) and global longitudinal peak strain (GLS). Two-sided unpaired t tests were used. f, Systolic function by echocardiography in normokalemic (n = 7 mice) and hypokalemic (n = 6) mice, indicated by end-systolic and end-diastolic left ventricular volumes, stroke volume and ejection fraction. Two-sided unpaired t tests were used. g, Gating strategy for cardiac leukocytes. h, Bland-Altman diagram demonstrating the difference of the ventricular tachycardia (VT) burden between two observers in percent. Dashed line: Bias. Dotted lines: Limits of Agreement (LoA). i, Representative ECG tracings from an invasive electrophysiological study. j, Inducibility of ventricular tachycardia (VT) after pacing in naive, hypokalemic and MI mice. Mouse numbers are indicated in plot. MI mice were measured 5 hrs after surgical induction. One-sided Chi-square test was used. k, Ventricular effective refractory period (n = 6 or n = 8 mice per group) in naive, hypokalemic and mice 5 hrs after MI. For STORM mice, catheter insertion caused spontaneous VTs which made an EP study impossible. One-way ANOVA followed by Tukey’s multiple comparisons test were used. l, Experimental outline. m, Incidence of ventricular arrhythmias and VT burden in male (n = 10 mice) and female (n = 8) mice after STORM procedure. Fisher’s exact test (VT and Vfib incidence) and two-sided Mann Whitney test (VT burden) were used. Data are mean ± SEM.