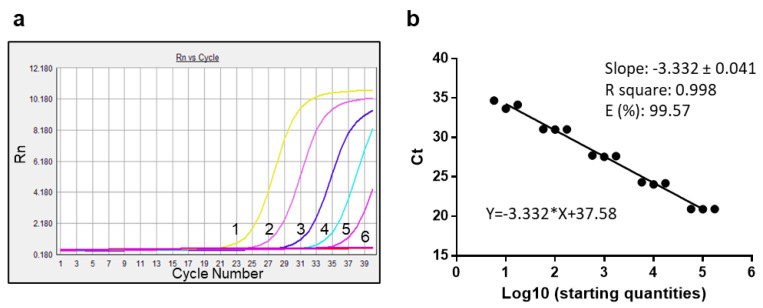
Figure 5.
SYBR Green real-time PCR amplification efficiency. (a) Amplification curves obtained from tenfold dilutions of the cDNA corresponding to 105 molecules of template RNA. Identification numbers reported in Table 2. (b) Serial dilutions of the cDNA template, corresponding to the identification numbers reported in Table 2, were used and assayed in triplicate. Each black circle refers to one of these assessments. The resulting Ct values are plotted against the Log10 of the starting quantity. Calculation of the slope, R2, and efficiency, are also reported.

