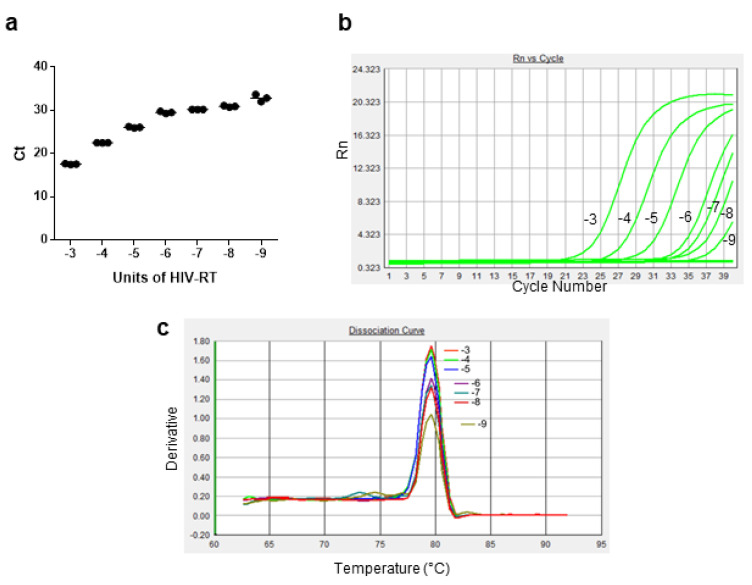
Figure 7.
Effects of different amounts of HIV-1 RT on the outcome of the optimized RT-qPCR assay. Main reaction conditions: gD-RNA-synt = 106 molecules, RT-primer = 500 nM, dNTPs = 0.1 mM, incubation time = 4 h. (a) Plot graph of triplicate Ct values (line = mean values) versus the HIV RT quantities. (b) Amplification curves and (c) dissociation curves obtained with HIV-1 RT amounts ranging from 10−3 to 10−9 U. Graphics and data refer to one representative experiment.

