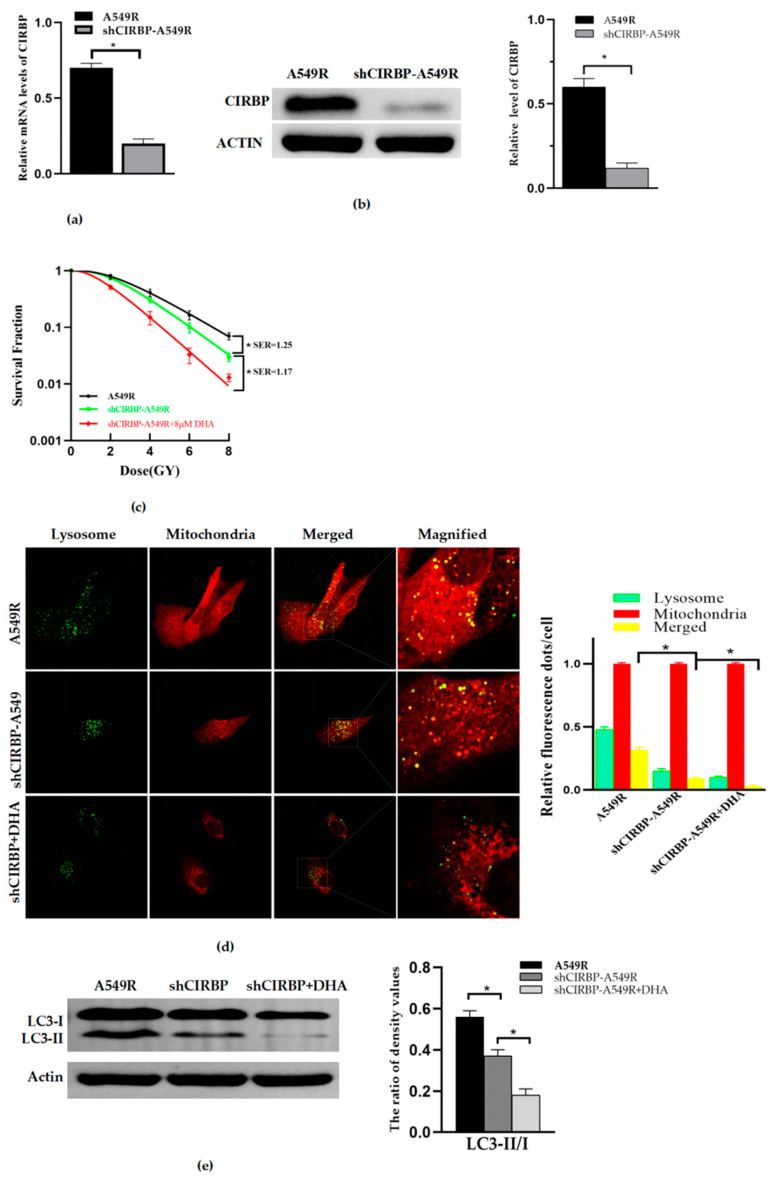
Figure 5.
Knockdown of CIRBP inhibits the mitophagy and radioresistance of A549R. (a) The relative RNA level of CIRBP with or without CIRBP knockdown in A549R cells. (b) The relative protein level of CIRBP with or without CIRBP knockdown in A549R cells. (c) The survival fractions of A549R cells and shCIRBP–A549R with or without DHA (8 μM, 24 h) were fitted by the multitarget–single hitting model according to a clonogenic assay. (d) Representative fluorescence images of A549R cells and shCIRBP–A549R cells with or without DHA (8 μM, 24 h) treated with Mito-Tracker (Red) and Lyso-Tracker (Green) (×40) (Left). Relative fluorescence spot numbers per cell. A total of 100 cells were counted for each analysis (right). (e) Western blot assay of LC3-I, LC3-II, and actin proteins and the relative ratio of LC3-II/LC3-I in A549R cells and shCIRBP-A549R cells with or without DHA (8 μM, 24 h). * p < 0.05 between the indicated groups.

