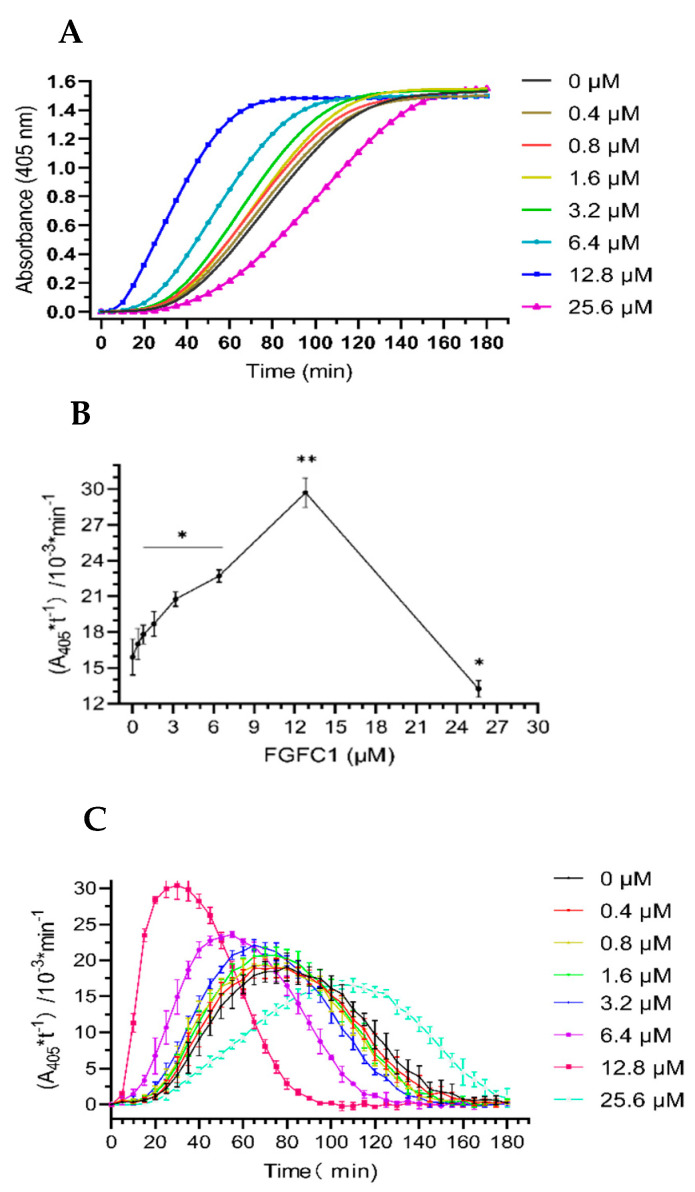
Figure 2.
Fibrinolytic activity of FGFC1 (0–25.6 μM). (A) The absorbance–time curve of the mixture system was measured at 405 nm at 37 °C for 180 min using a microplate reader. (B) The Kn (the slope of each curve) values of FGFC1 (0–25.6 μM) in the reaction system. Results expressed as the mean ± SD of three parallel experiments. * p < 0.05, ** p < 0.01, compared to the control group (absence FGFC1). (C) The reaction rates of FGFC1 (0–25.6 μM) at different times (0–180 min).

