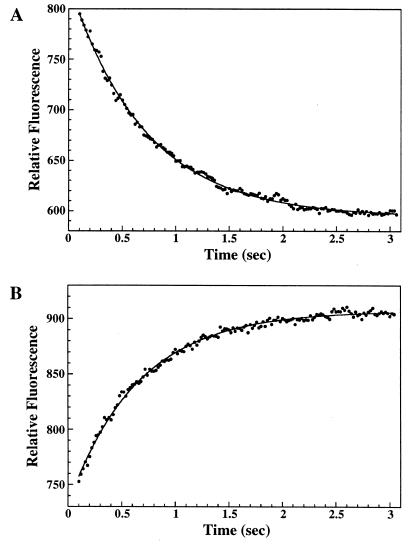
FIG. 6.
Dissociation of guanine nucleotides from CgtA. (A) Dissociation of mant-GDP. CgtA–mant-GDP (generated by prebinding 1 μM mant-GDP with 3 μM CgtA) in 5 mM Mg2+ was rapidly mixed with excess GDP (150 μM) in a stopped-flow fluorimeter, and the change in the relative fluorescence intensity over time was monitored, giving a kd of 1.44 ± 0.01 (average of 10 trials). (B) Dissociation of GDP. CgtA-GDP complexes (generated by prebinding 1 μM CgtA with 0.3 μM GDP) in 5 mM Mg2+ were rapidly mixed with excess mant-GDP (10 μM) in a stopped-flow fluorimeter, and the change in fluorescence intensity over time was monitored, resulting in a kd of 1.45 ± 0.01 (average of 10 trials). Representative profiles for the dissociation of guanine nucleotides are shown. The curve-fitted data are shown with a solid line. Relative fluorescence equals a + be−kdt).

