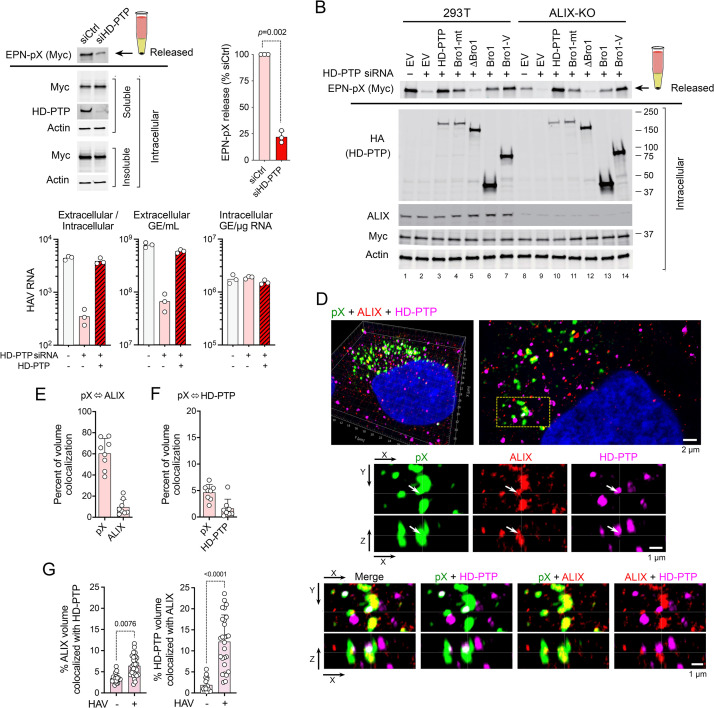
Fig 6. HD-PTP is functionally required for EPN-pX and HAV release.
(A) EPN-pX release from 293T cells with RNAi-mediated knockdown of HD-PTP (encoded by PTPN23) (see legend to Fig 2D for details of release assay). siCtrl = scrambled siRNA pool. Quantitative analysis on the right with release normalized to release from siCtrl-transfected cells. n = 3 independent experiments. p-value by t-test with Welch’s correction. (B) Rescue of EPN-pX release by overexpression of HD-PTP, HD-PTP with L202D and I206D substitutions (Bro1-mt), or HD-PTP deletion mutants (see Fig 5C) in HD-PTP-depleted 293T cells (lanes 2–7), and HD-PTP-depleted CRISPR-Cas9 engineered 293T ALIX knockout (ALIX-KO) cells (lanes 9–14). siRNA: ‘+’ = siHD-PTP, ‘-’ = scrambled siCtrl. EV = empty vector. (C) (left to right) Ratio of extracellular/intracellular HAV RNA, extracellular HAVl RNA, and intracellular HAV RNA, 48 hrs after cell-free virus infection of Huh-7.5 cells with and without prior RNAi depletion of HD-PTP. Data shown are technical replicates from one of 3 experiments with similar results. GE = genome equivalent. (D) Merged and single-channel super-resolution Airyscan fluorescent microscopy images of pX (green, labelled with monoclonal antibody), endogenous ALIX (red), and endogenous HD-PTP (magenta) in an 18f virus-infected Huh-7 cell. A 3D reconstruction is shown on the top left with a sectional view to the right. Below are single- and dual-channel images shown in two projections (X-Y and X-Z). Arrows in the middle panels indicate a prominent site of pX colocalization with both ALIX and HD-PTP. (E) Quantitative estimates of pX-ALIX volume colocalization in Z-stack images: the first column shows the percentage of pX volume (voxels with pX signal above threshold) containing ALIX signal above threshold; the second column shows the percent ALIX volume containing pX signal. (n = 8 cells). See Methods for details. (F) Quantitative volume analysis of pX colocalization with HD-PTP similar to that in panel E. (G) Voxel colocalization of ALIX with HD-PTP (left) and HD-PTP with ALIX (right) in HAV-infected and uninfected Huh-7.5 cells. Adjusted p-values determined by ANOVA with Kruksal-Wallis test. n = 17–27 cells from multiple experiments.

