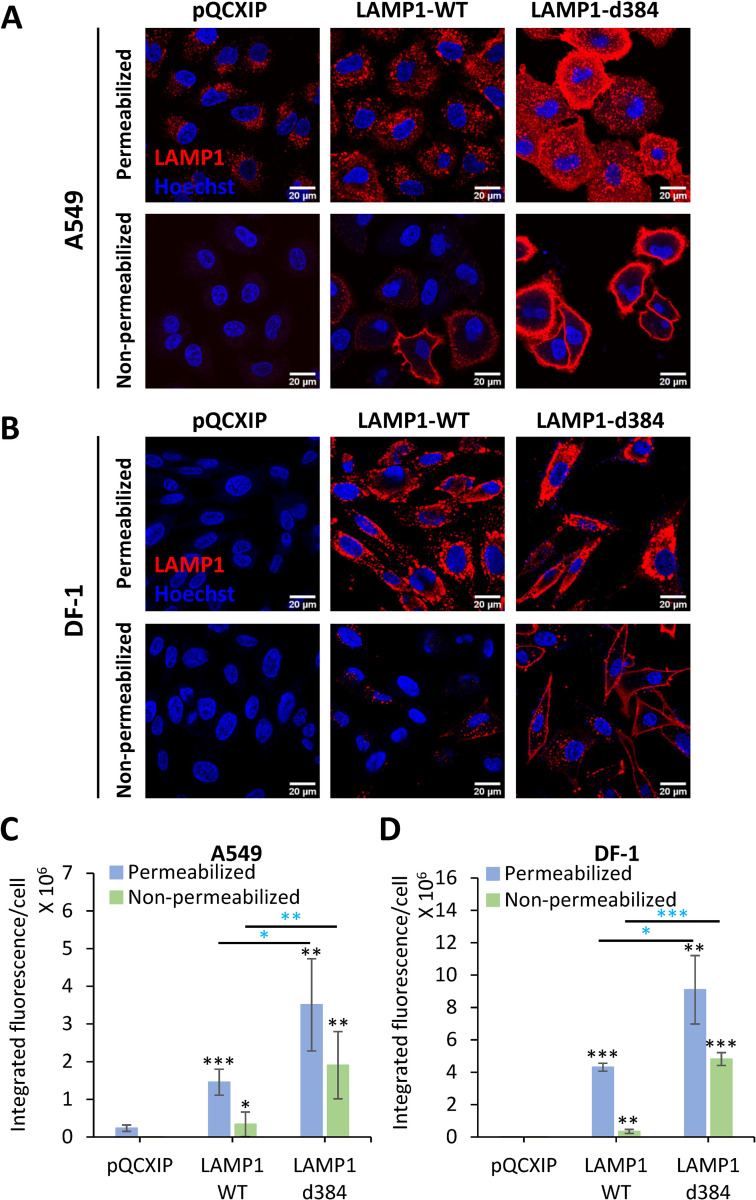
Fig 1. Analysis of endogenous and ectopic expression and localization of hLAMP1 in A549 and DF-1 cells.
A549 or DF-1 cells were transduced with an empty pQCXIP vector (control) or vector expressing human LAMP1-WT or the LAMP1-d384 mutant. Cells were fixed and whether left untreated (bottom panels in A and B) or permeabilized with 125 μg/ml digitonin and immunostained for human LAMP1. (A, C) Images and quantification of hLAMP1 expression in A549 cells. Images acquired under same exposure conditions, but the brightness and contrast settings in panel A and B are different to ensure optimal display. (B, D) Images and quantification of hLAMP1 expression with DF-1 cells. Data shown are means ± SD of five fields of view for each condition. Blue asterisks show significance levels for the difference between LAMP1-WT and LAMP1-d384. Black asterisks on the top of bars represent significance relative to the vector control. Data were analyzed by Student’s t-test. *, p<0.05; **, p<0.01; ***, p<0.001.

