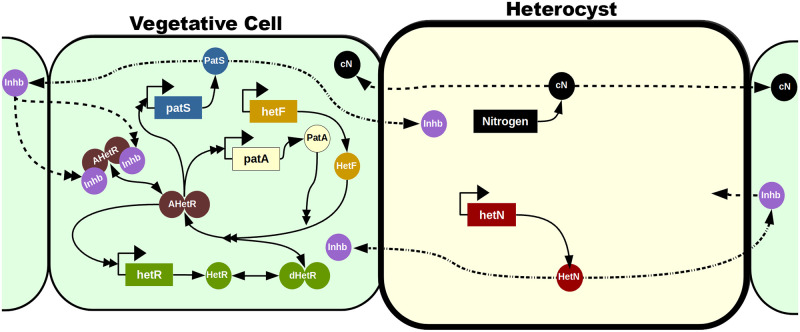
Fig 2. Mechanistic model.
The vegetative cells are represented with a soft green background while the heterocyst has a soft yellow background and a thicker cell wall. Genes are represented in rectangles and proteic elements with circles. The dimers are represented with two attached circles and can be inactivated (in green), activated (in brown), and activated and inhibited (in brown with two attached purple inhibitors). Solid lines represent production (with only one simple arrowhead), transformations (with a simple arrowhead in both ends), and interactions (with a double arrowhead). Dashed lines represent inter-cellular traffic and dashed-doted lines represent a transformation when exported to a neighboring cell.

