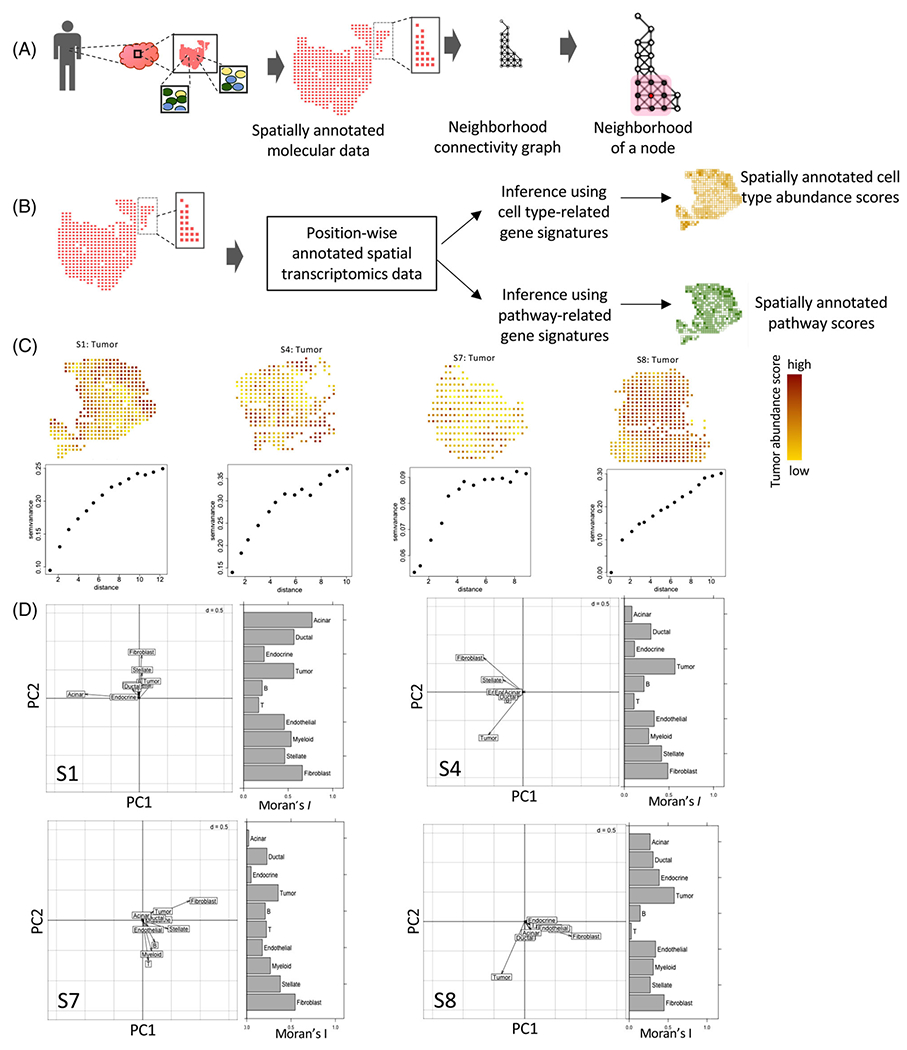
FIGURE 1.

(A) A schematic representation showing a collection of tissue from a patient and spatial transcriptomics on a tissue section to profile the transcriptome of multiple spatially annotated units simultaneously. Based on the spatial annotation of the units, a neighborhood graph can be constructed. (B) A flowchart showing inference on cell type and pathway scores from spatial transcriptomic data using gene signatures. (C) Tumor cell abundance score from spatial transcriptomics data for the pancreatic ductal adenocarcinoma specimens. The variograms indicate the decay in correlation in tumor cell estimate score over distance in terms of the spatial units in the tumor microenvironment. (D) Multivariate spatial analysis showing joint variation in spatial localization of the cell types in the four samples. The spatial principal component analysis (sPCA) plot shows the loading of different cell types along the first two principal axes. Moran’s I indicate the extent of spatial autocorrelation coefficients of the cell types.
