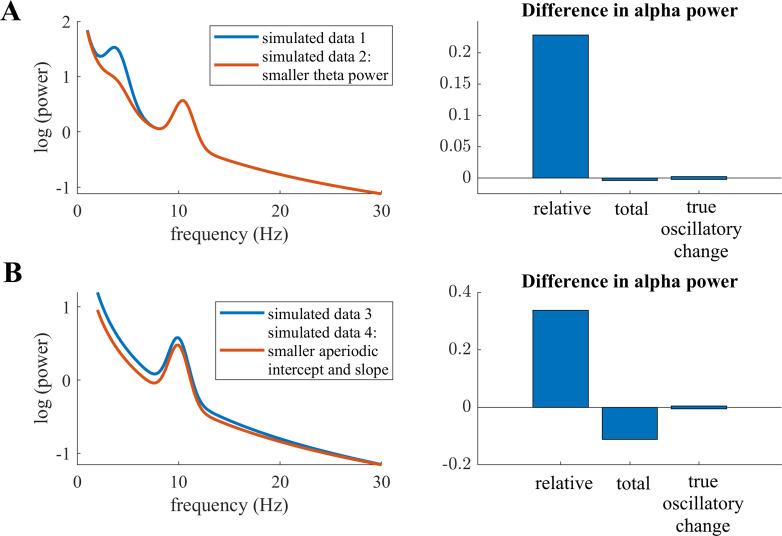
Appendix 1—figure 1. Visualizations of possible fallacies in total and relative power measures in simulated data.
Bar plots on the right indicate the difference in alpha power between simulated data 2 and simulated data 1 in A, and simulated data 4 to simulated data 3 in B. (A) Two simulated power spectra with identical true alpha oscillatory power. The high amplitude oscillation in the theta range (~5 Hz) in simulated data 1 conflates results in relative power differences in the alpha band. (B) Two simulated power spectra with identical alpha oscillatory power. Here, differences in the aperiodic intercept and slope between the two signals conflate results in total and relative power differences in the alpha band.

