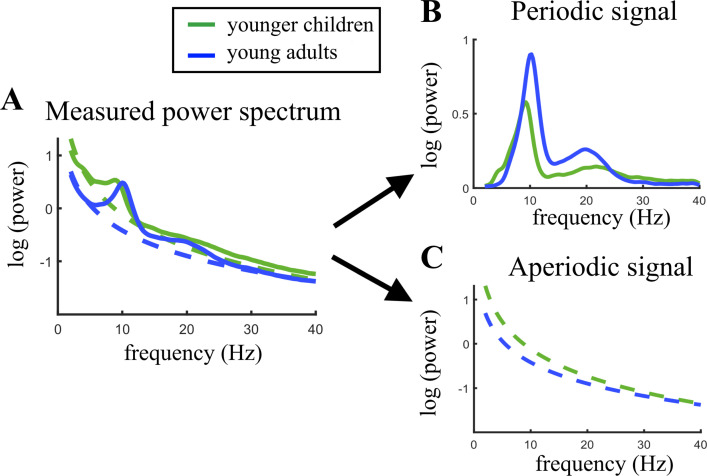
Figure 2. Visualization of age-related changes during brain maturation in (A) the measured power spectrum (i.e., total power spectrum), (B) the periodic (i.e. aperiodic-adjusted) power spectrum, and (C) the aperiodic signal.
Younger children represent the 20% youngest children in the sample, young adults the 20% oldest participants. This split of the sample was only done for visualization purposes and not used in any statistical analysis.

