. 2022 Aug 25;11:e77571. doi: 10.7554/eLife.77571

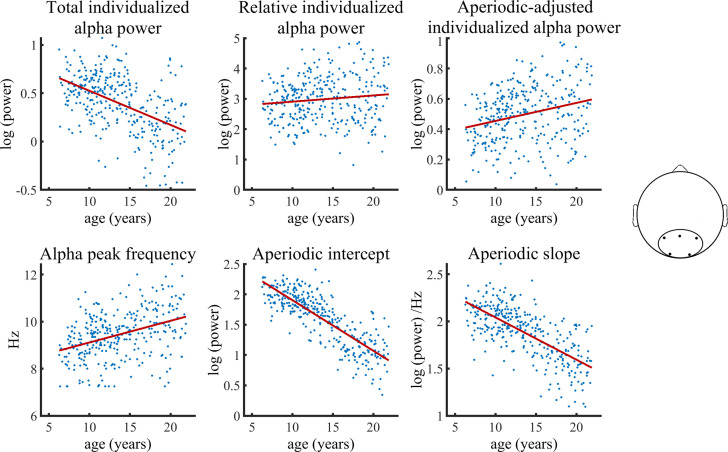
Figure 3. Visualization of data of the validation sample used in the Bayesian regression model.

Solid lines represent fitted regression lines. The schematic head on the right indicates the location of the electrode cluster from which data was aggregated.

Figure 3—source data 1. Numerical data for each scatterplot displayed in Figure 3.

Figure 3.

Figure 3—figure supplement 1. Distribution of age and gender in the final included validation sample plotted in Figure 3 and used for the statistical analyses.
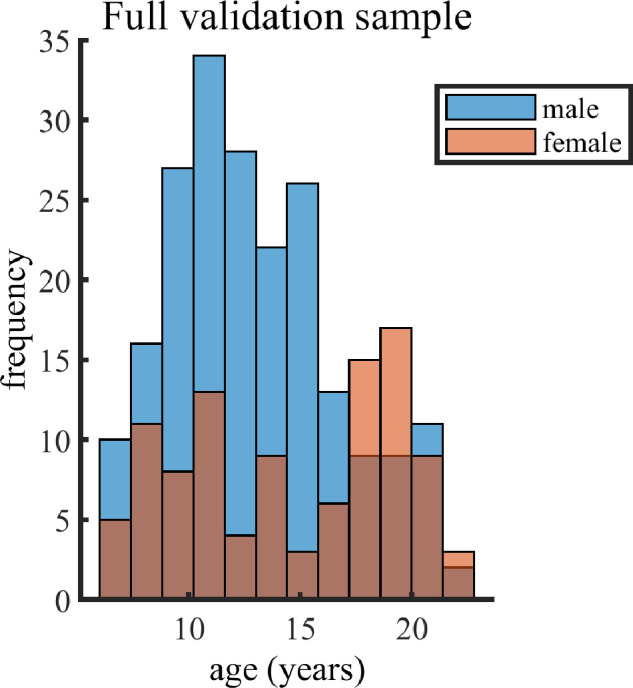
Figure 3—figure supplement 1.

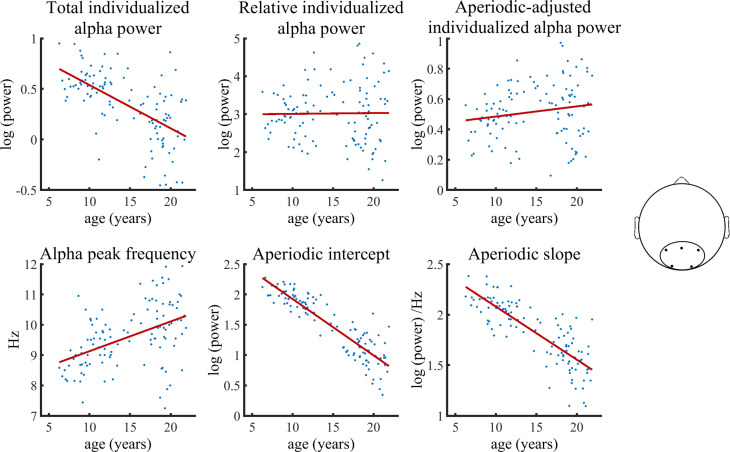
Figure 3—figure supplement 2. Visualization of data of the healthy validation subsample used in the Bayesian regression models.

Figure 3—figure supplement 2.

Solid lines represent fitted regression lines. The schematic head (right) indicates the location of the electrode cluster from which data was aggregated.