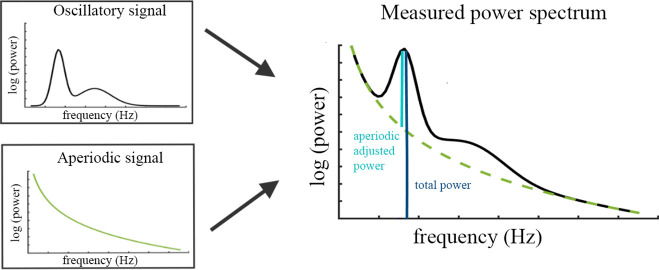
Figure 4. Illustration of the two components (left) superimposed in the measured neural power spectrum (right).
The dark blue bar (right) indicates how total power is assessed relative to the absolute zero. The light blue bar represents aperiodic-adjusted power, which is assessed relative to the aperiodic signal.

