. 2022 Aug 1;11:e77725. doi: 10.7554/eLife.77725

Figure 1. Prolonged β-adrenergic receptor (β-AR) activation disperses ryanodine receptor (RyR) clusters.

(a) Representative reconstructions of interior RyR clusters based on 3D dSTORM in isolated rat cardiomyocytes (clusters were cropped from a region measuring 5 x 8 x 0.6 μm). Control conditions are compared with isoproterenol treatment (100 nM) of varying duration (10, 30, and 60 min). The insets depict single Ca2+ release units (CRUs), which encompass RyR clusters with edge-to-edge distances ≤ 100 nm. (b–d) Quantification of the dSTORM data revealed progressive dispersion of RyR clusters during isoproterenol treatment, as indicated by measurements of RyR cluster size, CRU size, and cluster density. (e) RyR density was unchanged (control: ncells = 50, nhearts = 6; Iso 10: ncells = 21, nhearts = 3; Iso 30: ncells = 43, nhearts = 4; Iso 60: ncells = 37, nhearts = 5). (f) Correlative imaging of the t-tubular network (confocal microscopy) and RyRs (dSTORM) was employed to create 3D reconstructions of dyadic and non-dyadic CRUs (t-tubules: blue; RyRs: orange). Scale bars: 250 nm. (g) Similar proportions of clusters were characterized as dyadic under control conditions and following 60 min isoproterenol. (h) Cluster size measurements indicated that dispersion during isoproterenol occurred exclusively within dyads (control: ncells = 20, nhearts = 3; Iso 60: ncells = 21, nhearts = 3). The bar charts present mean measurements ± SEM, with superimposed data points representing averaged values from each cardiomyocyte. Statistical significance (p<0.05) between groups is indicated by a comparison bar.

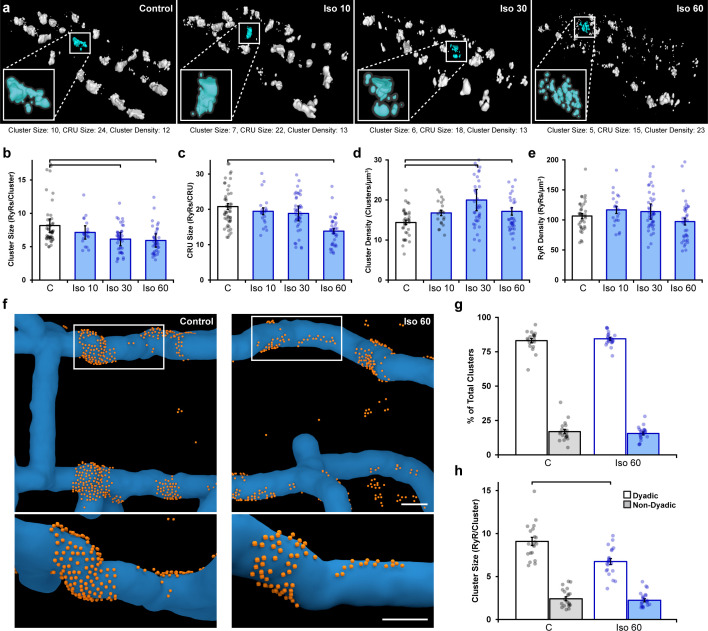
Figure 1.

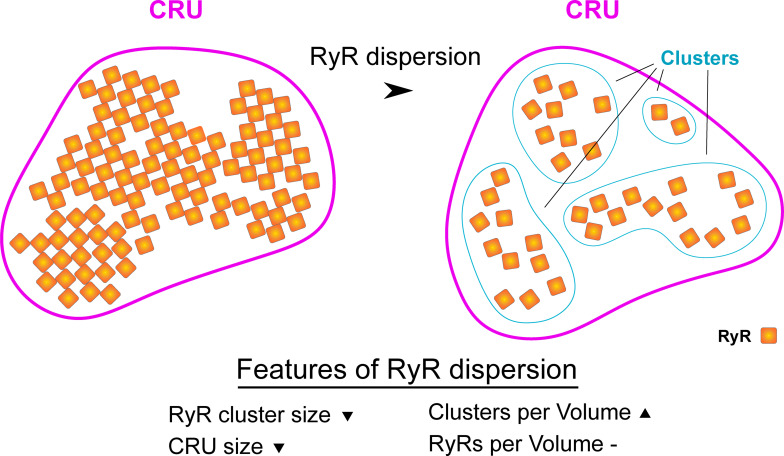
Figure 1—figure supplement 1. Schematic illustrating hallmarks of ryanodine receptor (RyR) cluster dispersion.

Figure 1—figure supplement 1.

Dispersion of RyR groups results in a reduction in the average number of RyRs contained in each cluster. This change occurs in parallel with an increase in the total number of clusters as there are now more numerous, smaller clusters in a given 3D space. If marked RyR cluster dispersion occurs, the total number of RyRs contained in a Ca2+ release unit (CRU) may also be reduced as clusters are no longer located in close enough proximity to be grouped in functional release units (edge-to-edge distances ≤ 100 nm).
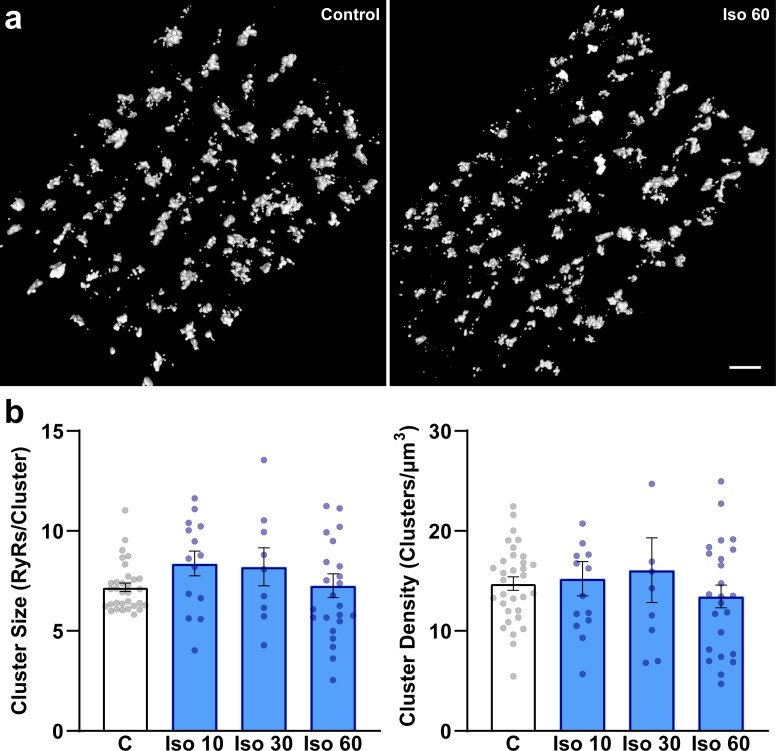
Figure 1—figure supplement 2. β-Adrenergic receptor (β-AR) stimulation does not significantly influence ryanodine receptor (RyR) organization on the cell surface.

Figure 1—figure supplement 2.

Representative images (a) and data (b) indicate that, in contrast to interior RyRs (Figure 1), RyR clusters remain intact during prolonged β-AR stimulation. Scale bar: 1 μm. (control: ncells = 32, nhearts = 3; Iso 10: ncells = 14, nhearts = 4; Iso 30: ncells = 12, nhearts = 4; Iso 60: ncells = 24, nhearts = 4).
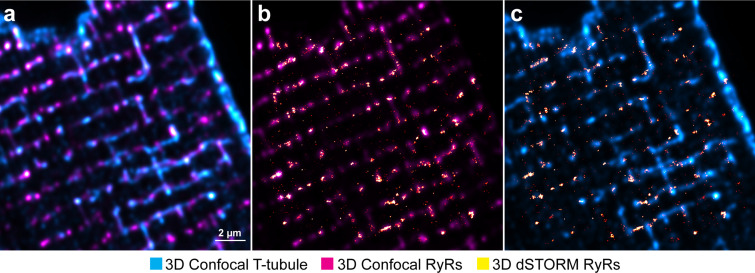
Figure 1—figure supplement 3. Method for correlative imaging of ryanodine receptors (RyRs) and t-tubules for dyad reconstruction.

Figure 1—figure supplement 3.

(a) A 3 µm-thick confocal stack of RyRs and t-tubules is acquired, immediately followed by 3D dSTORM imaging of RyRs in the same region. After deconvolution, confocal images are rescaled to the same voxel size as the dSTORM image. (b) Using a custom-written Python script to correct for lateral, axial, translational, and rotational differences, confocal and dSTORM imaged RyRs are aligned. (c) Using the derived transformational differences, confocal t-tubules are finally aligned with dSTORM RyRs in 3D space.