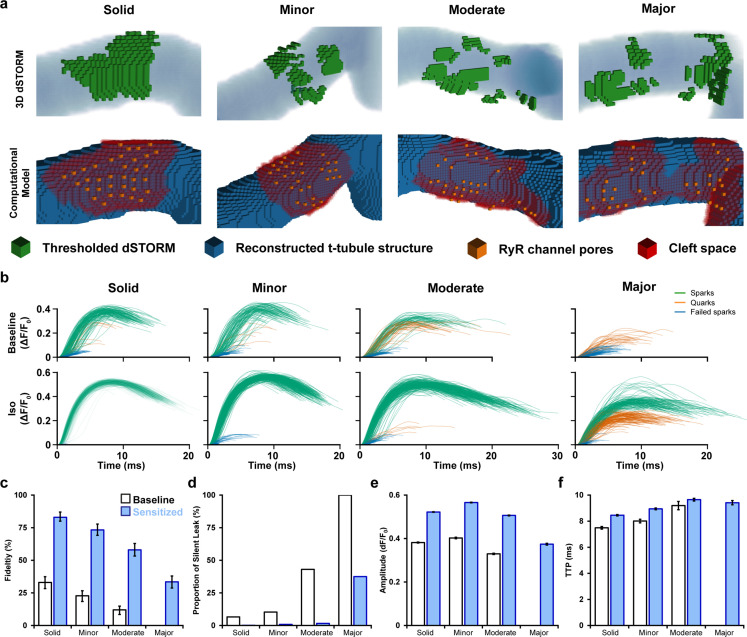
Figure 5. Mathematical modeling linking changes in ryanodine receptor (RyR) configuration and function during β-adrenergic stimulation.
(a) 3D computational volumetric meshes built from correlative imaging of the t-tubular network (confocal microscopy) and RyRs (3D dSTORM). Constructed geometries consisted of 10 × 10 × 10 nm voxels and a 1 × 1 × 1 µm volume. The four geometries were chosen to represent the range of cluster dispersion seen in imaging (see Supplementary file 1 for details). (Top row) Reconstructed t-tubular structures (blue) are illustrated with superimposed thresholded RyR signals (green). (Bottom row) Corresponding computational geometries, with indicated RyR channel pores (orange) and cleft space (red) defined by morphological dilation around the RyRs. The four geometries were selected to represent the range of RyR dispersion observed in experiments, ranging from solid to majorly fragmented Ca2+ release units (CRUs) (see ‘Materials and methods’). (b) In total, 400 stochastic spark simulations were performed in each geometry with baseline model parameters, and another 400 were conducted with the regulatory effects of β-adrenergic receptor (β-AR) stimulation added (RyR sensitization and increased sarcoplasmic reticulum [SR] content). The ΔF/F0 time course is shown for each spark. The maximal amplitude used to define the release as an experimentally observable spark event (ΔF/F0 ≥ 0.3), a sub-spark quark event (ΔF/F0 ≥ 0.1), or a failed spark (ΔF/F0 < 0.1). (c, d) The classification of release into spark and non-spark events was used to estimate spark fidelity and the ratio of leak that is ‘silent’ (i.e., sub-spark release) in each simulation case. (e, f) Average amplitude and time to peak (TTP) measurements for observable sparks. Unshaded and shaded bars in (c–f) denote baseline and sensitized (simulated β-AR activation) RyR conditions, respectively. Error bars in (e) and (f) show SEM, while the bars in (c) indicate the 95% Agresti–Coull confidence interval.


