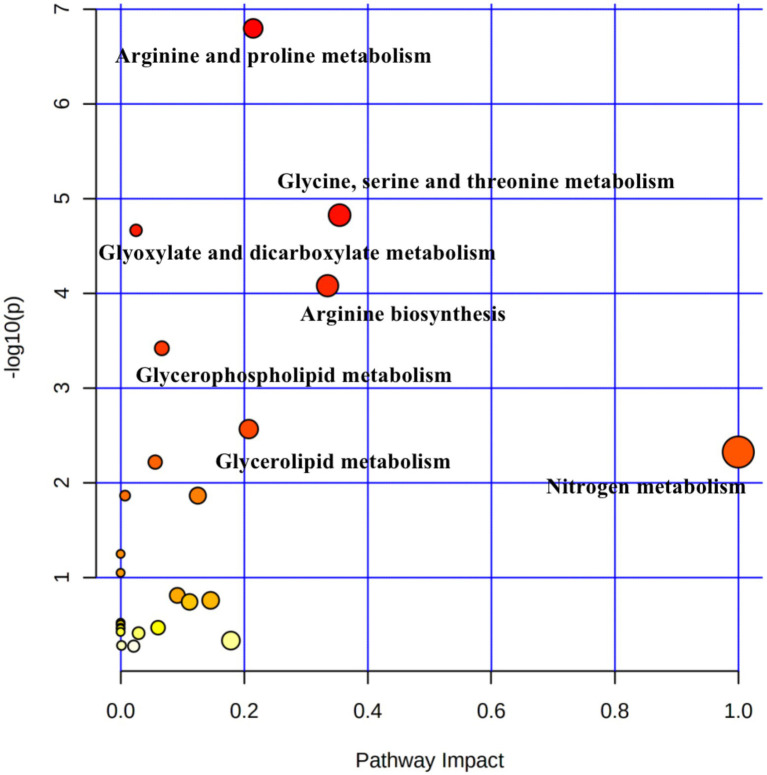
Figure 4.
Pathway analysis of differential metabolites in rumen samples from yaks with different dietary concentrate ratios using the Bos taurus Kyoto Encyclopedia of Genes and Genomes (KEGG) database of MetaboAnalyst 4.0. Larger circles indicate richer pathways and darker colors indicate higher pathway impact values. The closer the color is to red, the smaller the p-value.

