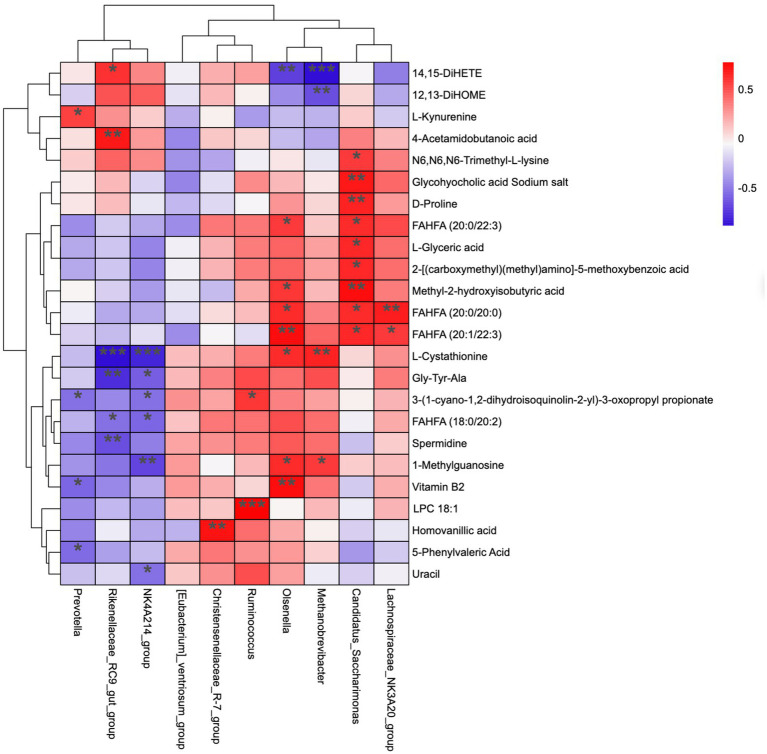
Figure 5.
Correlation matrix between genus level and rumen differential metabolites. Each row in the figure represents a metabolite, each column represents a genus, and each lattice represents the Pearson correlation coefficient between metabolite and genus levels. Red color indicates positive correlation, while blue color indicates negative correlation. *p < 0.05; **p < 0.01.

