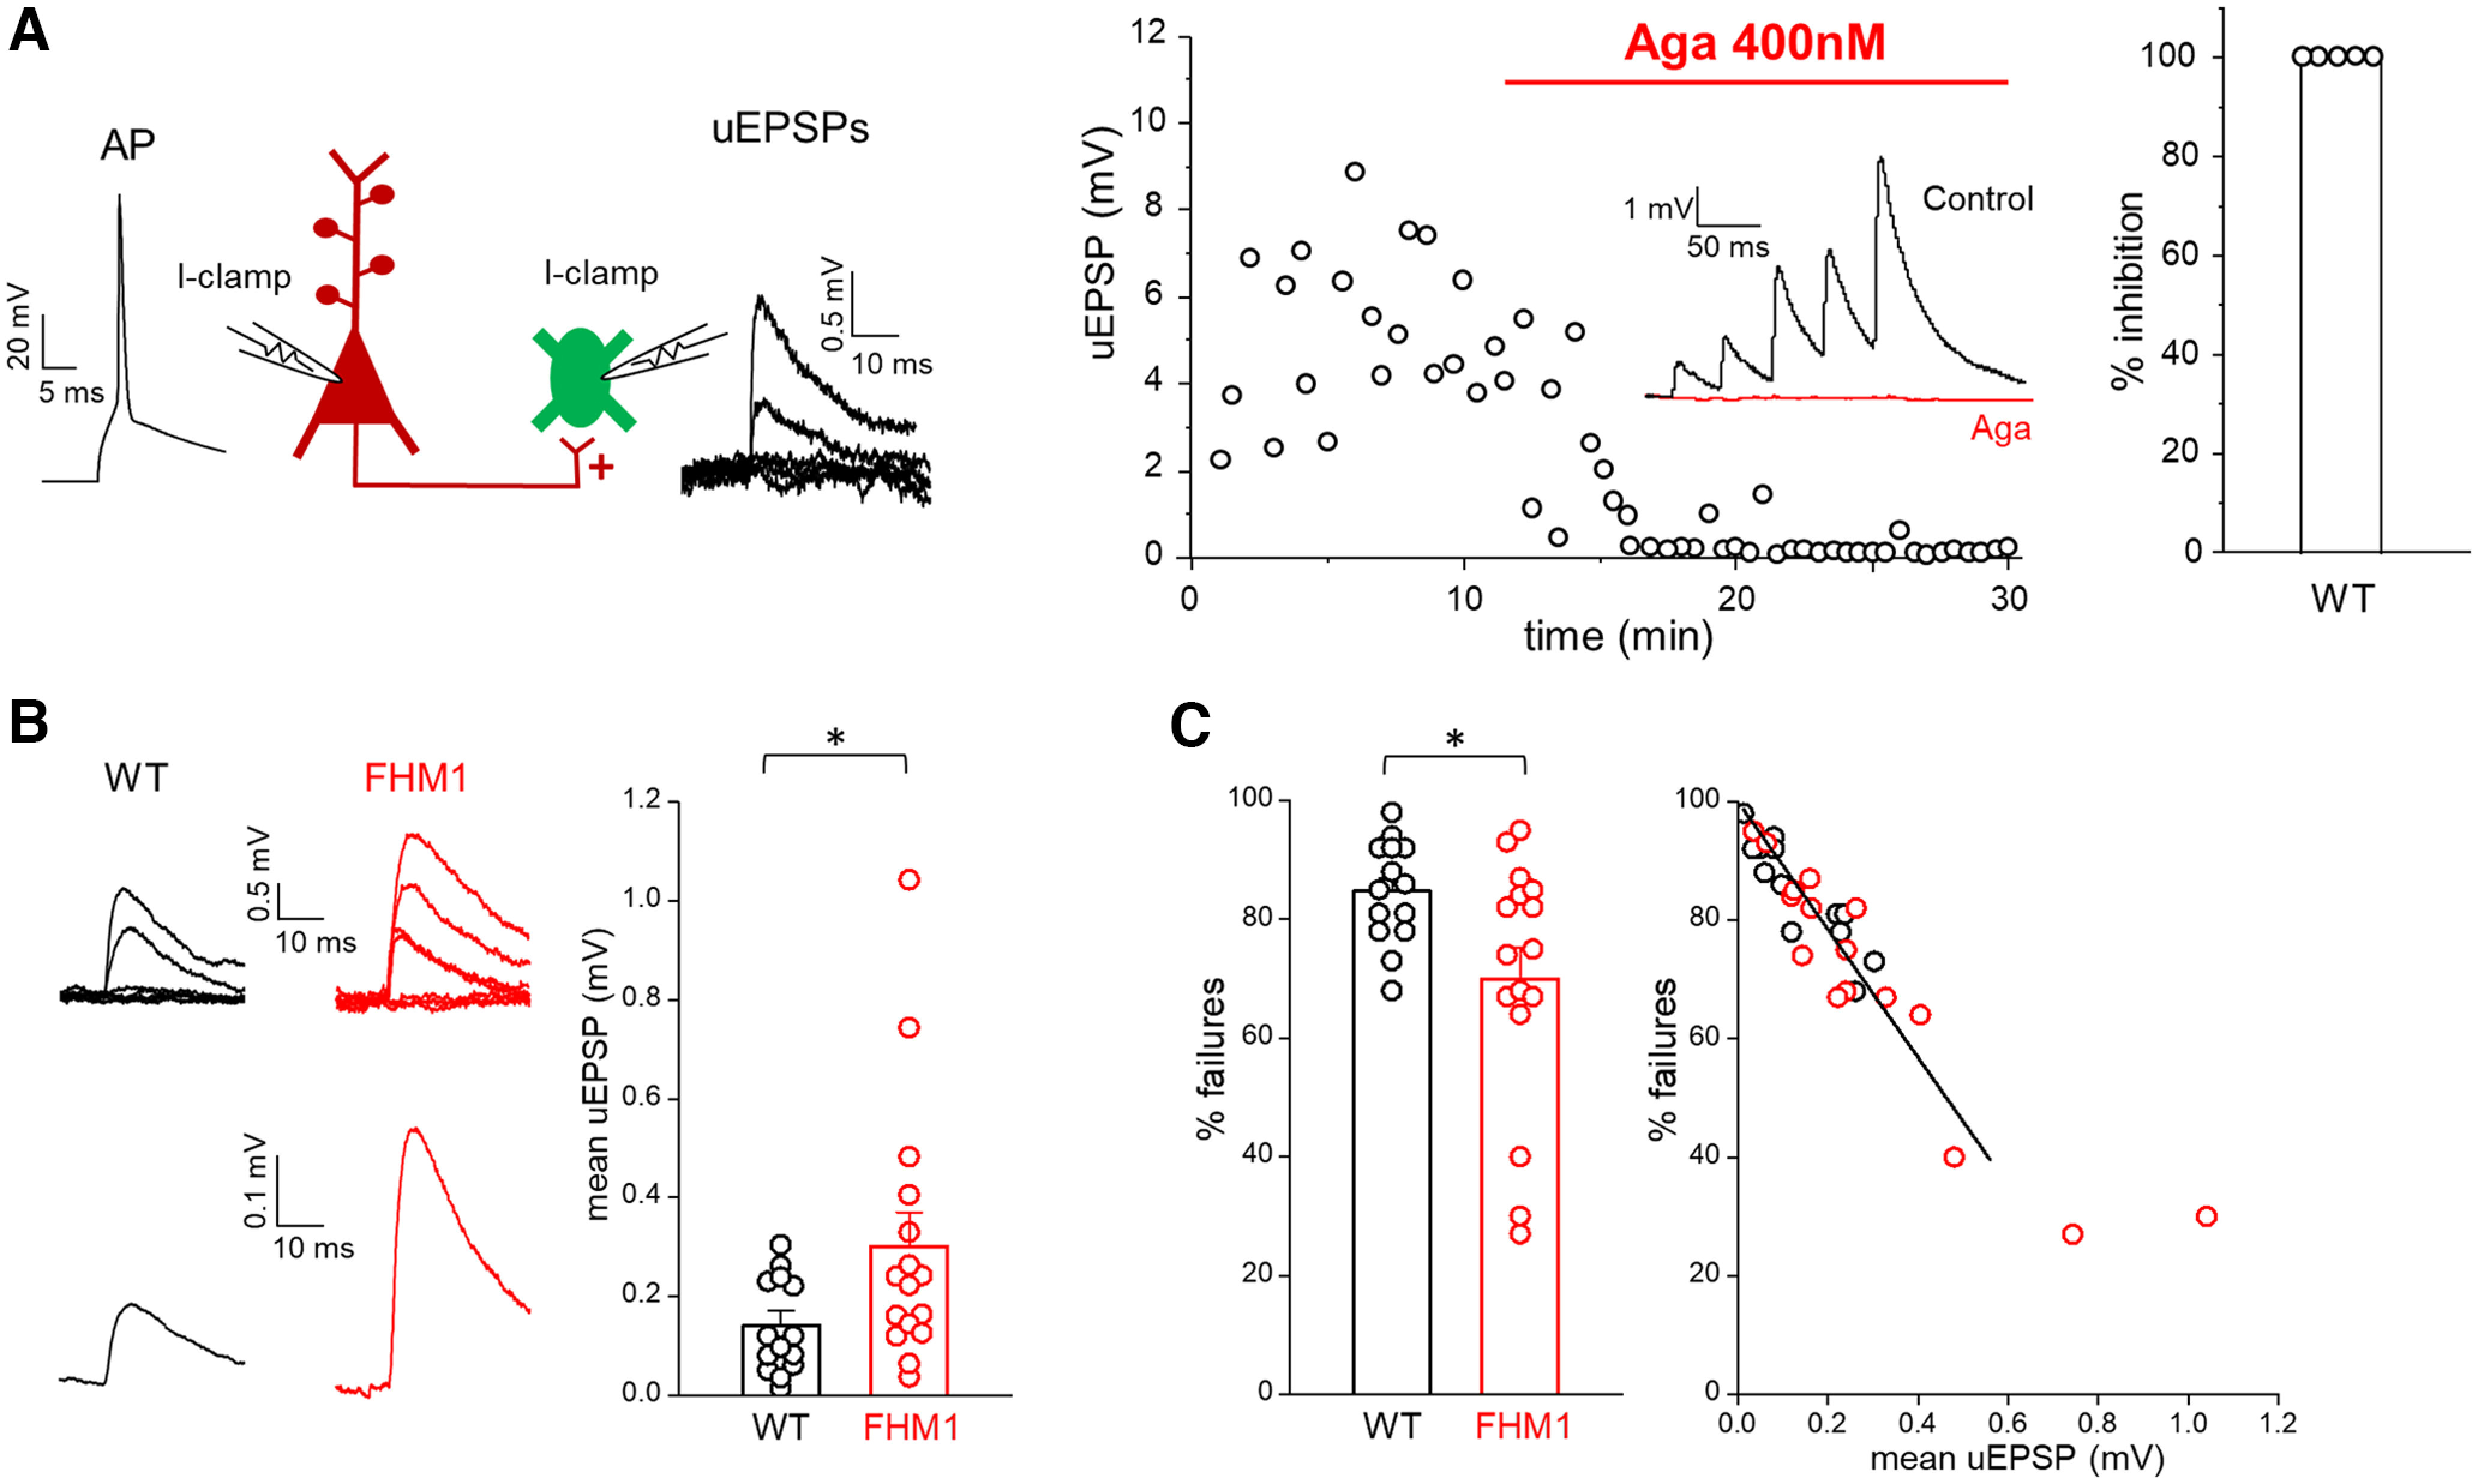
Figure 2.

Excitatory synaptic transmission between L2/3 PCs and SOM INs is enhanced in FHM1 mice. A, Left, Schematic diagram of the experimental configuration in which APs were elicited in a presynaptic L2/3 PC in current clamp (I-clamp; −70 mV) and the uEPSPs evoked by the APs were recorded in a connected postsynaptic L2/3 SOM IN in current clamp (I-clamp; −70 mV). Representative traces of a presynaptic AP and postsynaptic uEPSPs are also shown. Right, Time course of a representative experiment showing the uEPSPs evoked in a SOM IN before and after the application of a saturating concentration of Aga (400 nm) in a WT slice. Inset, Mean uEPSPs elicited in a SOM IN by 5 APs at 25 Hz in the presynaptic PC before (black) and after (red) bath application of Aga. Right, Percentages of inhibition of the mean uEPSP1 after application for 17 min of Aga (average value: 100 ± 0%, n = 5, N = 5). B, Left, Representative uEPSPs (top) evoked in a SOM IN and corresponding mean uEPSP (bottom) in WT (black) and FHM1 (red) mice. Right, Amplitudes of the mean uEPSP in L2/3 SOM INs in WT (average value: 0.14 ± 0.03 mV, n = 14, N = 13) and FHM1 (average value: 0.30 ± 0.07 mV, n = 16, N = 14) mice. The average value of the mean uEPSP elicited in a SOM IN by stimulation of a connected presynaptic PC is 2.1 times larger in FHM1 compared with WT mice (f(28) = 0.74, p = 0.025 MW test). C, Left, Percentages of failures in WT (average value: 85 ± 2%, n = 14, N = 13) and FHM1 (average value 70 ± 5% n = 16, N = 14) mice. The percentage of failures is 18% lower in FHM1 compared with WT mice (f(28) = 0.28, p = 0.039 MW test). Right, Percentages of failures measured in individual FHM1 and WT connections as a function of the mean uEPSPs measured in the same connections. Data (restricted to % failures ≥40%; see Materials and Methods) are best fitted by a shared linear function (for both the WT and FHM1) with slope −108 ± 5.
