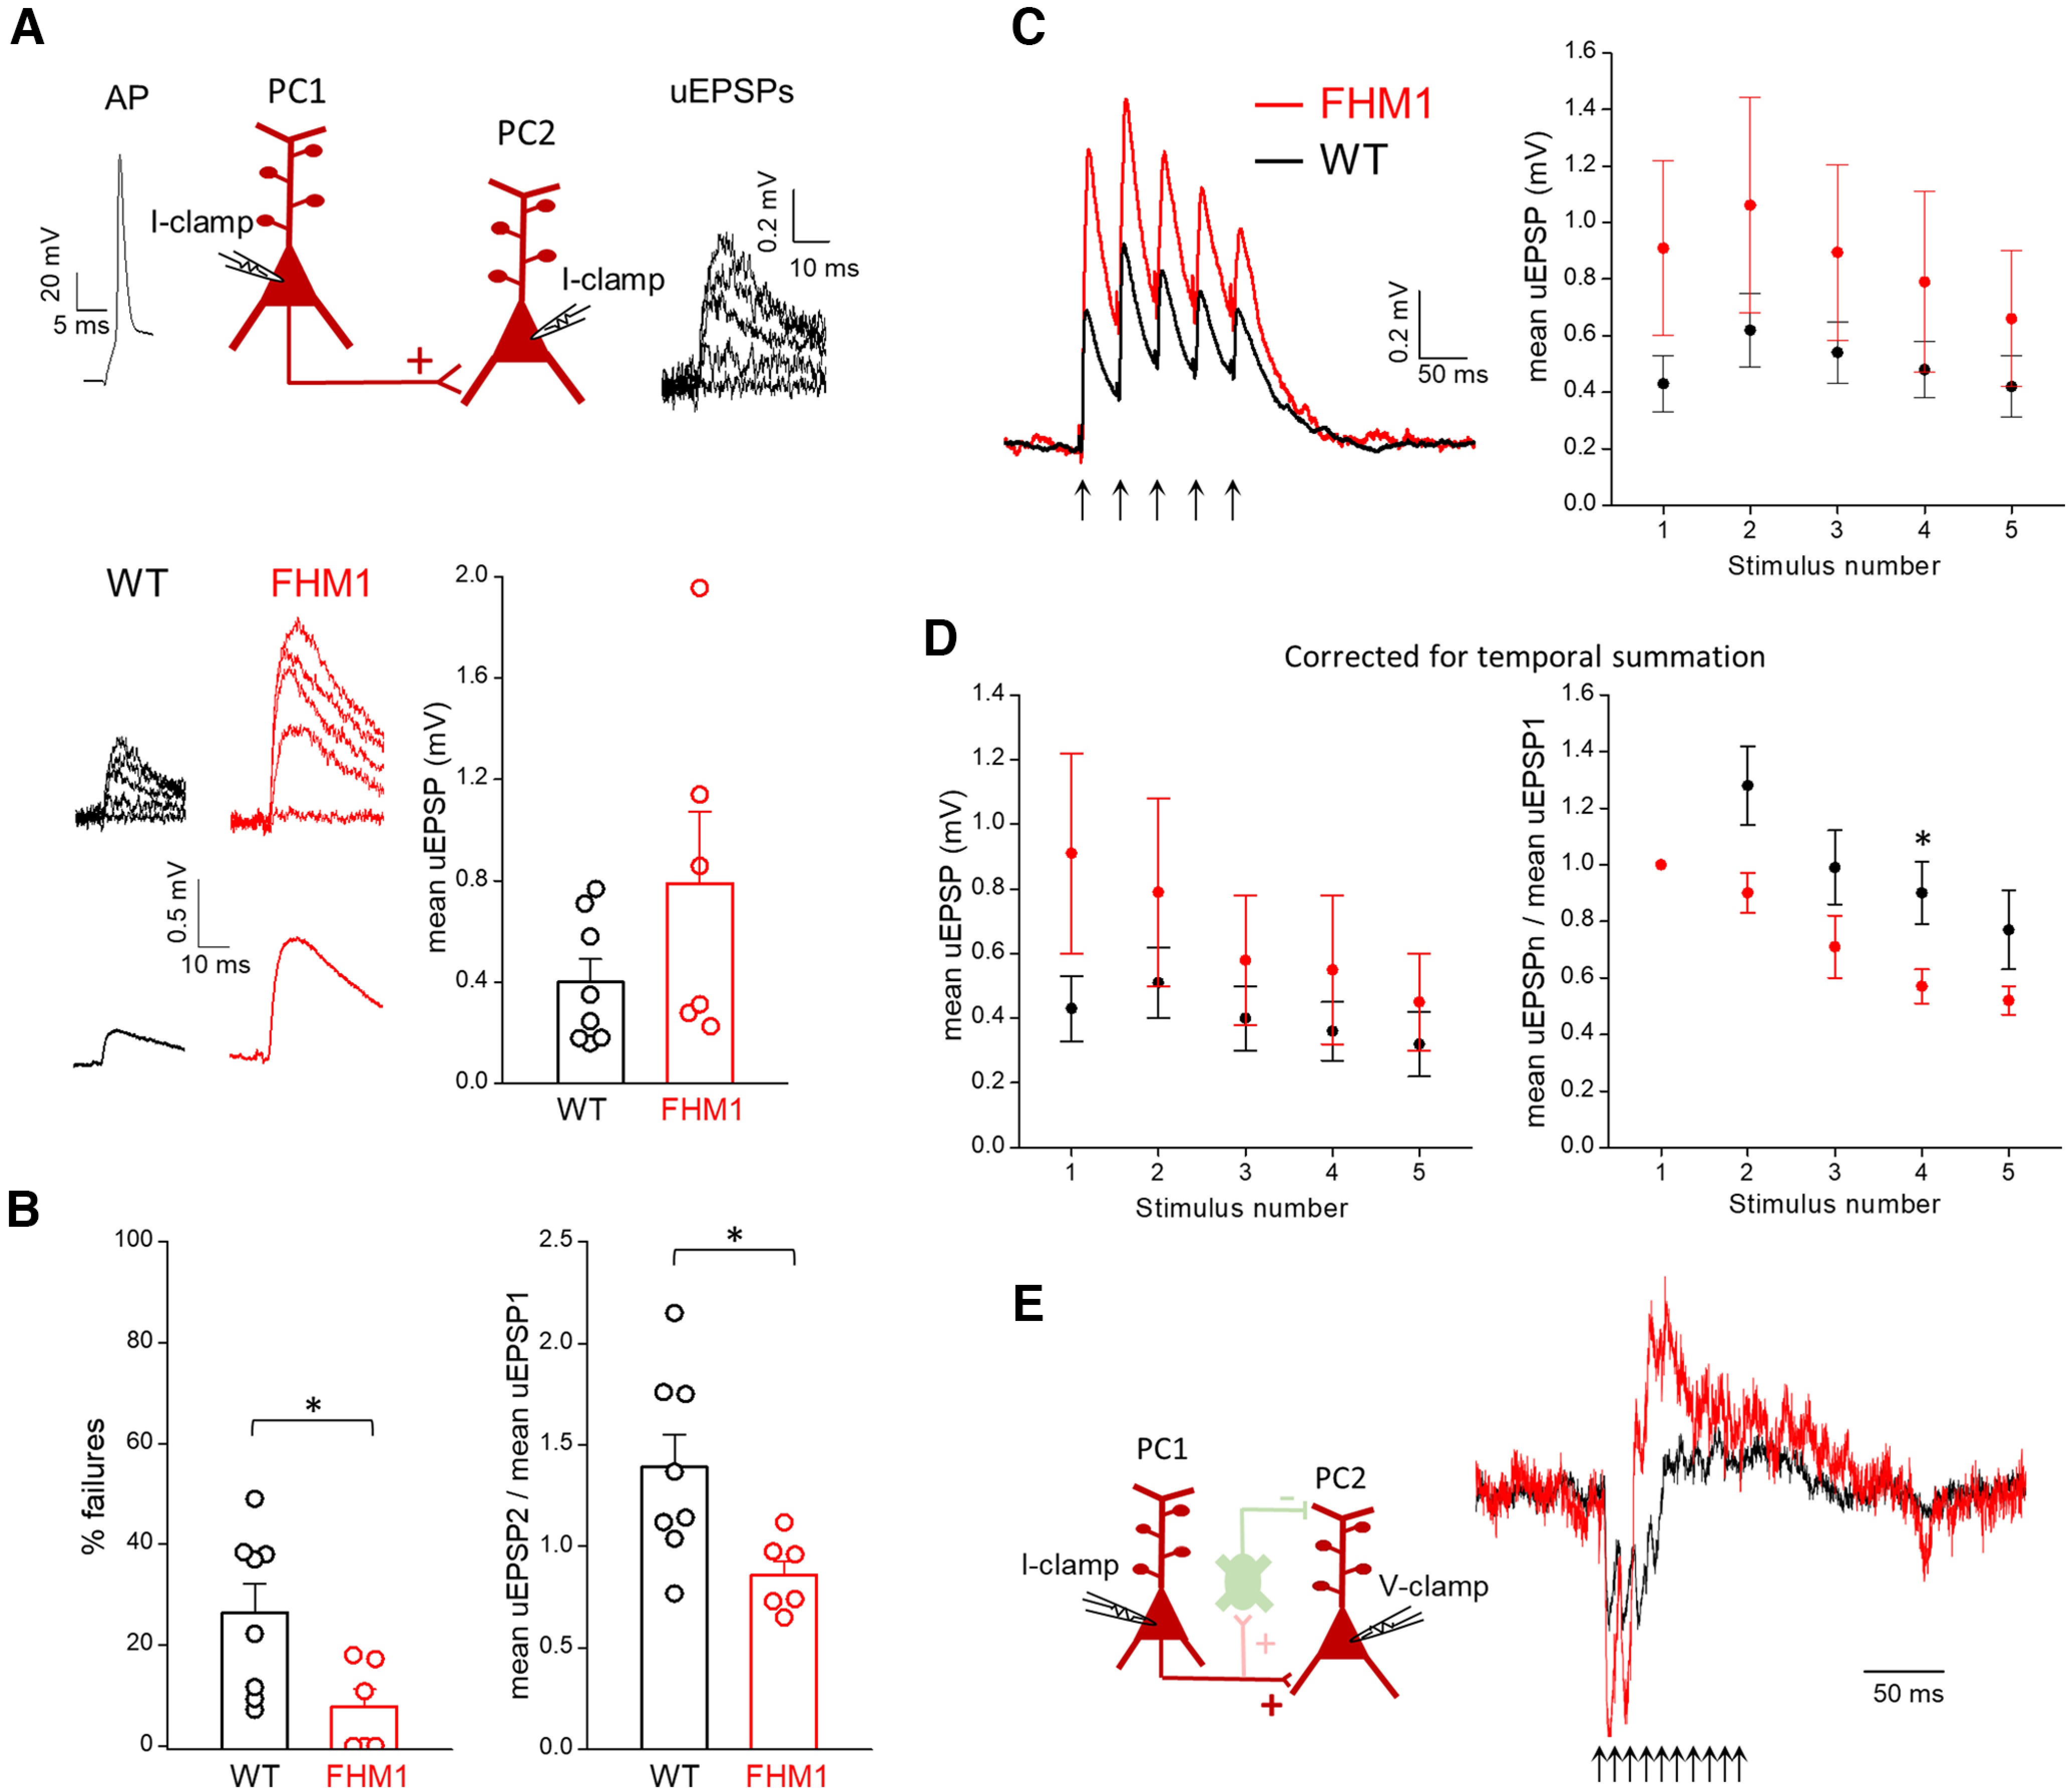
Figure 5.

Excitatory synaptic transmission between L2/3 PCs is enhanced in FHM1 mice. A, Top, Schematic diagram of the experimental configuration in which APs were elicited in a presynaptic L2/3 PC in current clamp (I-clamp) and the uEPSPs evoked by the APs were recorded in a connected postsynaptic L2/3 PC in current clamp (I-clamp). Representative traces of a presynaptic AP and postsynaptic uEPSPs are also shown. Bottom, Left, Representative uEPSPs (upper traces) evoked in the postsynaptic PC and corresponding mean uEPSPs (lower traces) in WT and FHM1 mice. Right, Amplitudes of the mean uEPSPs in WT (average value: 0.40 ± 0.09 mV, n = 8, N = 8) and FHM1 (average value: 0.79 ± 0.28 mV, n = 6, N = 5) mice. The mean uEPSP elicited in PCs by stimulation of a connected presynaptic PC is approximately two times larger in FHM1 compared with WT mice, but the difference is not statistically significant (t(12) = 1.54, p = 0.15, t test). B, Left, Percentages of failures in WT (average value: 27 ± 6%, n = 8, N = 8) and FHM1 (average value 8 ± 4% n = 6, N = 5) mice. Right, Paired pulse ratios (mean uEPSP2/mean uEPSP1, after correction for temporal summation; 40-ms interval) in WT (average value: 1.4 ± 0.2, n = 8, N = 8) and FHM1 (average value 0.86 ± 0.07, n = 6, N = 5) mice. The percentage of failures and the paired pulse ratio are both smaller in FHM1 compared with WT mice (by 70%, f(12) = 0.83, p = 0.04 MW test and 63%, t(12) = 2.61, p = 0.02 t test, respectively). C, Left, Average mean uEPSP responses elicited in postsynaptic PCs by a train of 5 APs at 25 Hz in connected presynaptic PCs (indicated by arrows below the traces) in WT (black trace; n = 7, N = 7) and FHM1 (red trace, n = 5, N = 5) mice. Right, Peak amplitudes of the mean uEPSP elicited in postsynaptic PCs as a function of stimulus number in WT (black, n = 7) and FHM1 (red; n = 5; repeated-measures ANOVA F(1,10) = 1.60, p = 0.23). D, Left, Peak amplitudes of the mean uEPSP elicited in postsynaptic PCs by each AP of 25-Hz trains in the presynaptic PC (after correction for temporal summation) as a function of stimulus number in WT (black, n = 7, N = 7) and FHM1 (red; n = 5, N = 5) mice (repeated-measures ANOVA F(1,10) = 1.26, p = 0.29). Right, Mean uEPSPs elicited in PCs by each AP of 25-Hz trains (after correction for temporal summation) divided by the mean uEPSP elicited by the first AP in the train (mean uEPSPn/mean uEPSP1) as a function of stimulus number n in WT (black, n = 7) and FHM1 (red; n = 5) mice. STD of the mean uEPSPs during the 25-Hz train is larger in FHM1 compared with WT mice and the gain-of-function of the mean uEPSPs produced by the mutation decreases during the train. E, Same experimental configuration as in Figure 4A, but PC1 and PC2 are connected and therefore, a 100-Hz train of 10 APs in PC1 produces both direct monosynaptic excitation and delayed disynaptic inhibition of PC2, as shown by the representative traces of the average current recorded in a WT PC2 cell (black trace) and a FHM1 PC2 cell (red trace). The traces were normalized to make the EPSC elicited by the first AP in the FHM1 trace to be two times larger than that in the WT trace (compare panel A).
