
Figure 4.
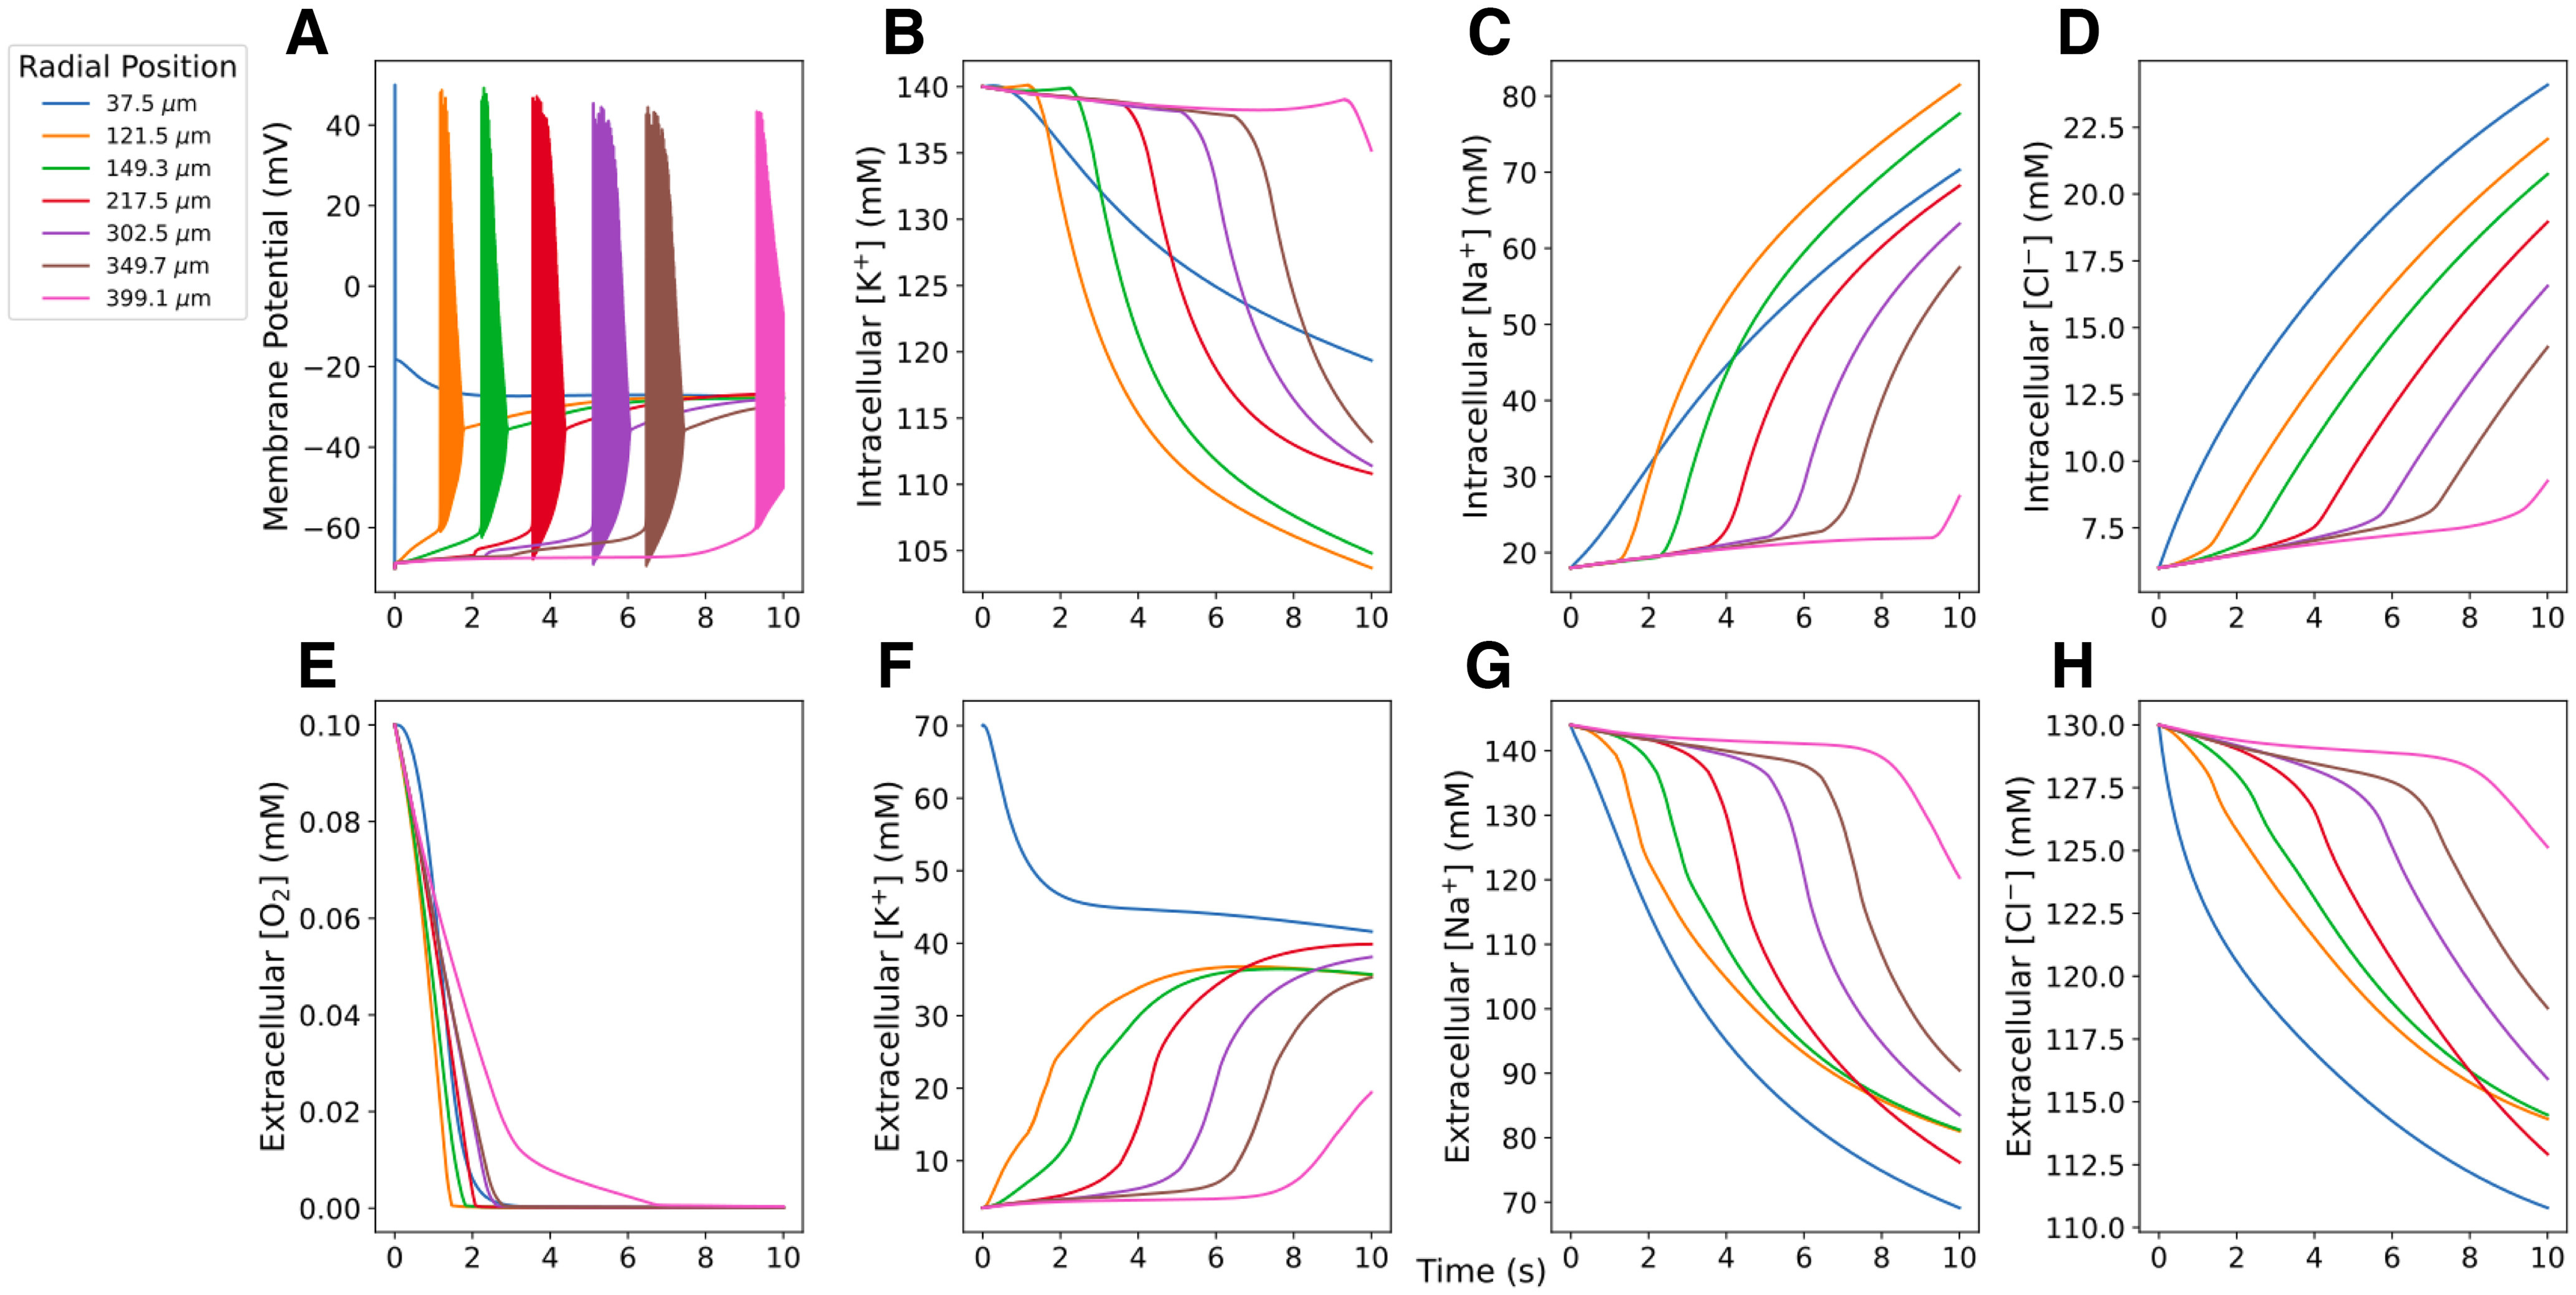
Concentrations at 7 radial locations measured during SD in perfused 400 μm slice. A, Cell within the K+ bolus (37.5 μm) produced a single spike; cells farther out fired a burst. Cells remained in depolarization block for the remainder of the simulation (10 s). B–D, Intracellular ion concentrations. E–H, Extracellular O2 and ion concentrations in neighboring ECS voxels. Movie 1 shows extracellular ion and O2 concentrations across the slice, as well as neuronal spiking (white dots) from 250 neurons during the course of SD (most easily seen with slowed playback).