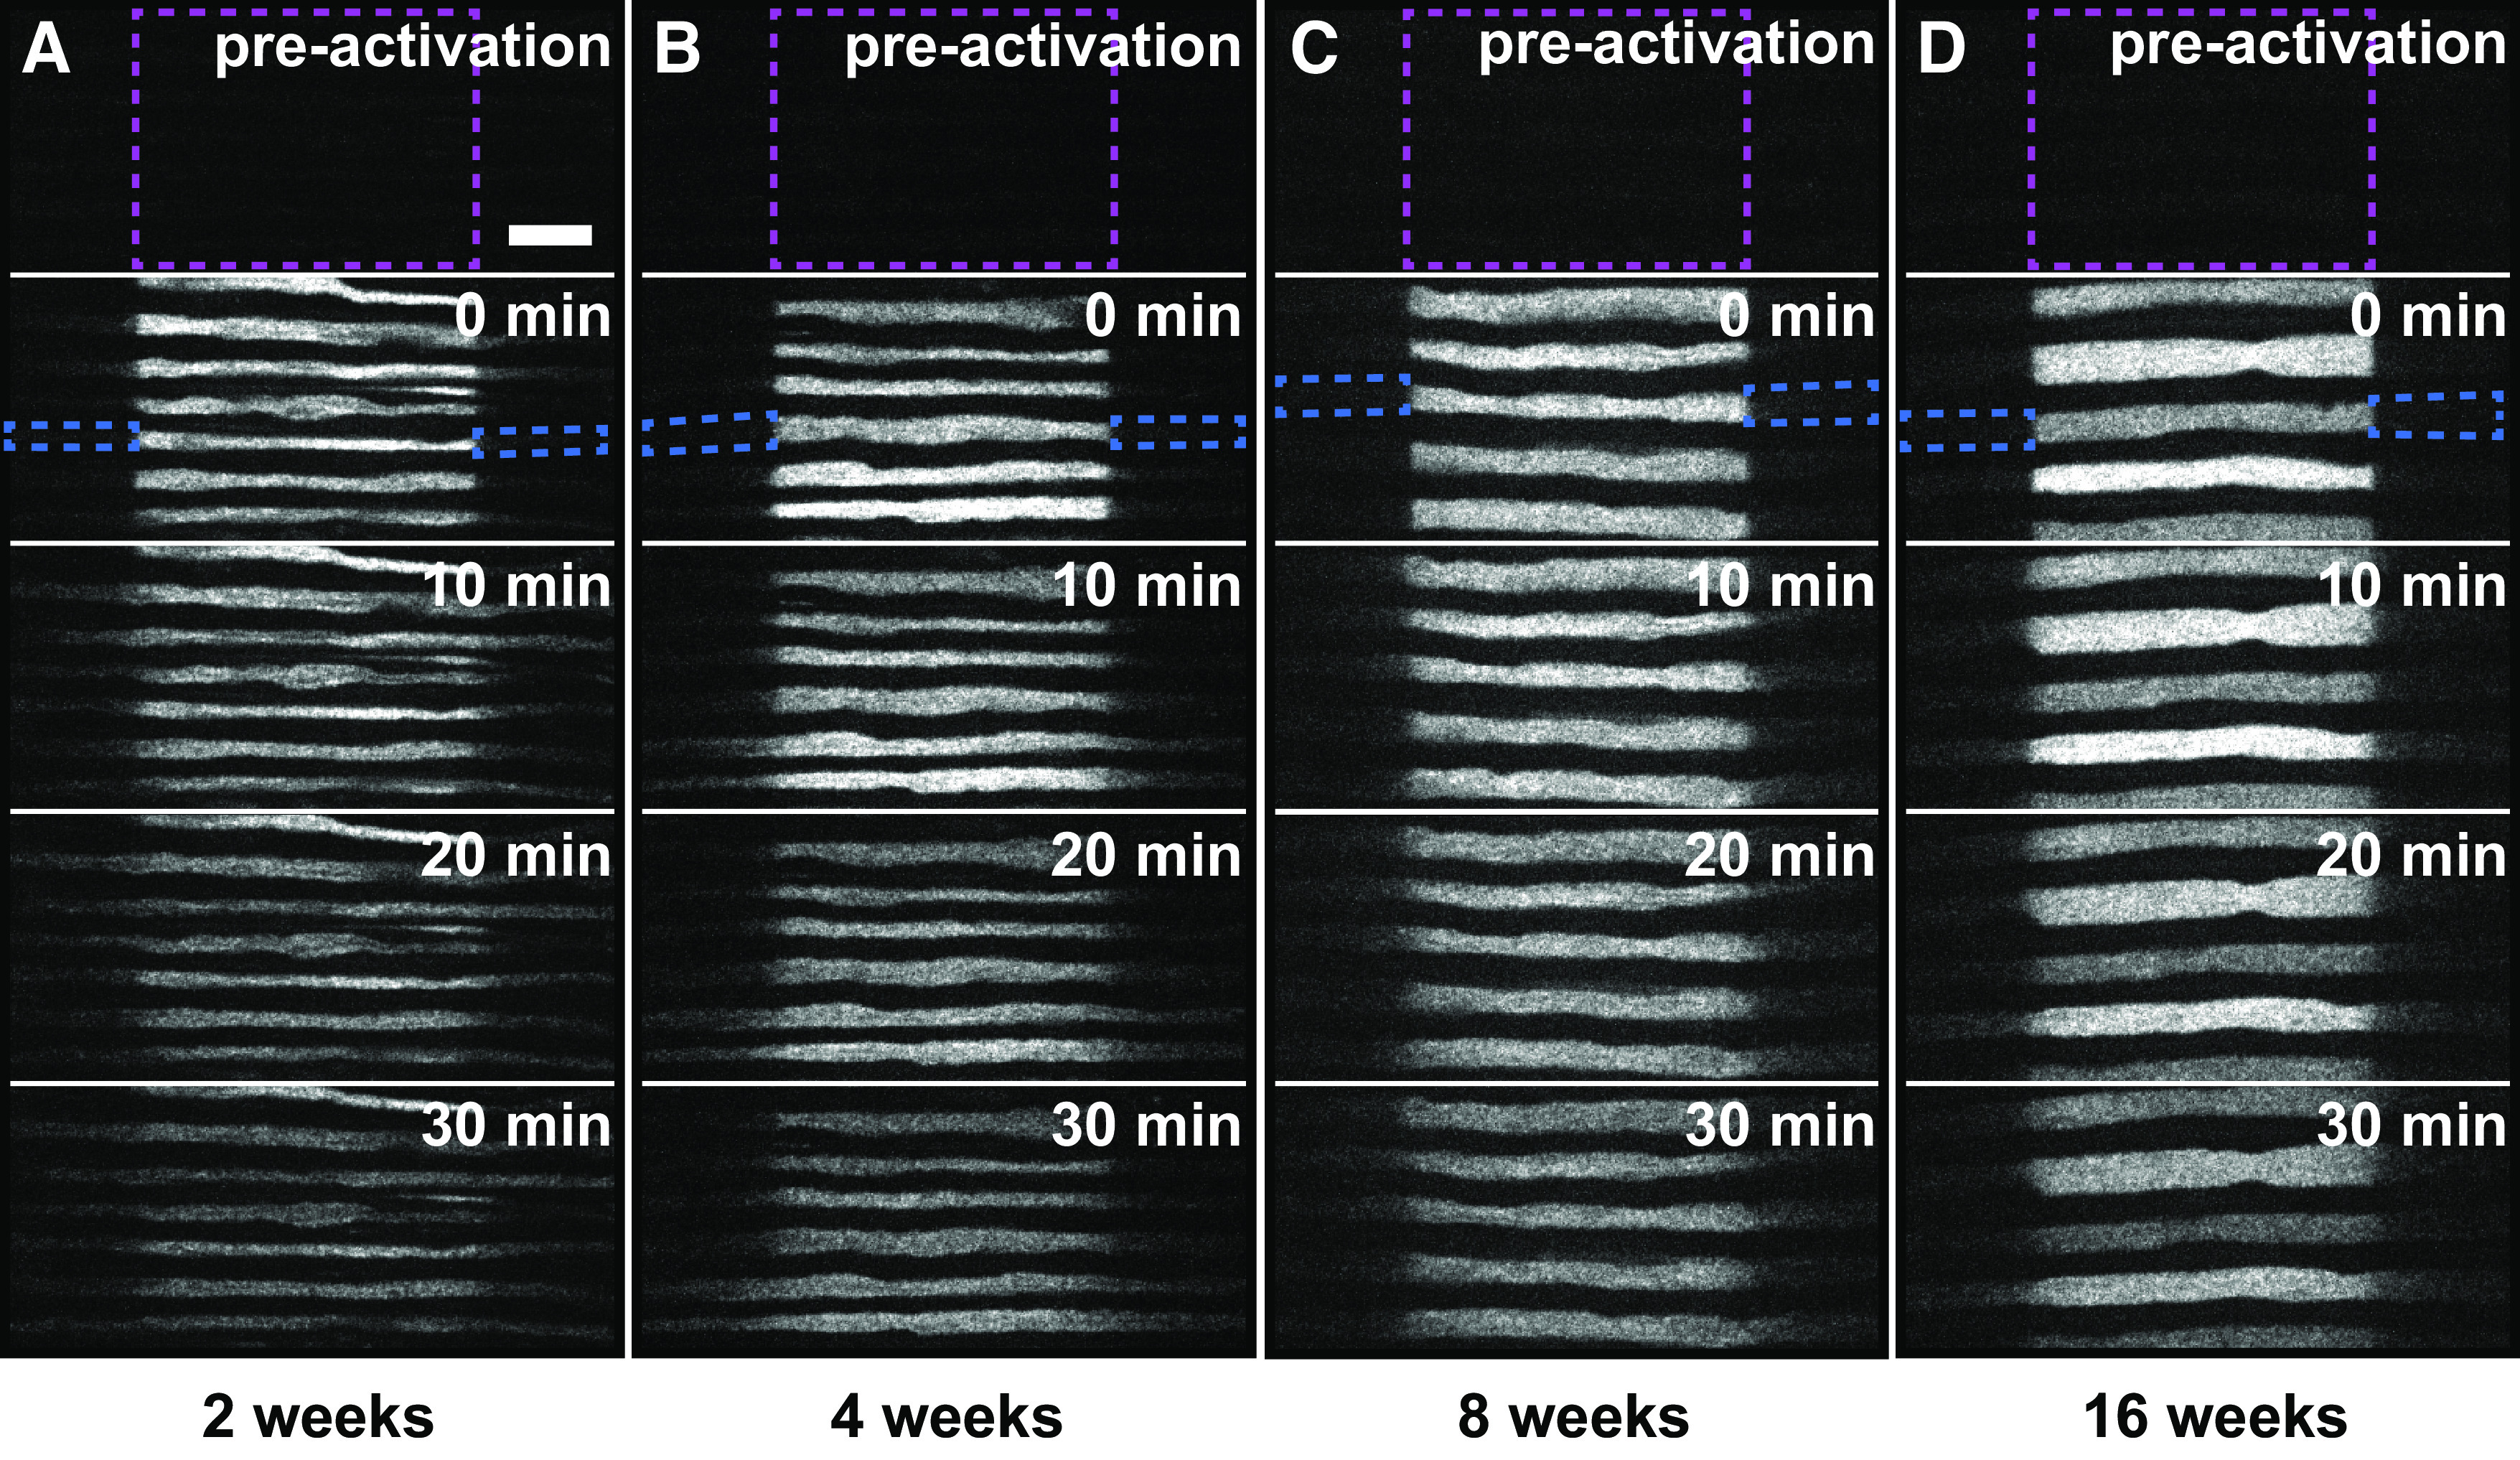
Figure 4.

Pulse-spread time-lapse image series of axons at different ages. A–D, Frames from representative time-lapse image series of pulse-spread experiments in the tibial nerves of male hThy1-paGFP-NFM mice that were 2 (A), 4 (B), 8 (C), and 16 weeks (D). The data for 8 weeks is reproduced from Figure 3 to allow side-by-side comparison with the other ages. The top frame represents the preactivation image. The dashed magenta box marks the activated region. The dashed blue boxes mark the proximal and distal flanking regions for one axon at t = 0 min. Note that there is some loss of fluorescence because of photobleaching in these raw images. Our quantitative analysis was confined to the first 4 min after activation, and the data were corrected for photobleaching (see Materials and Methods). Proximal is left; distal is right. Scale bar, 10μm.
