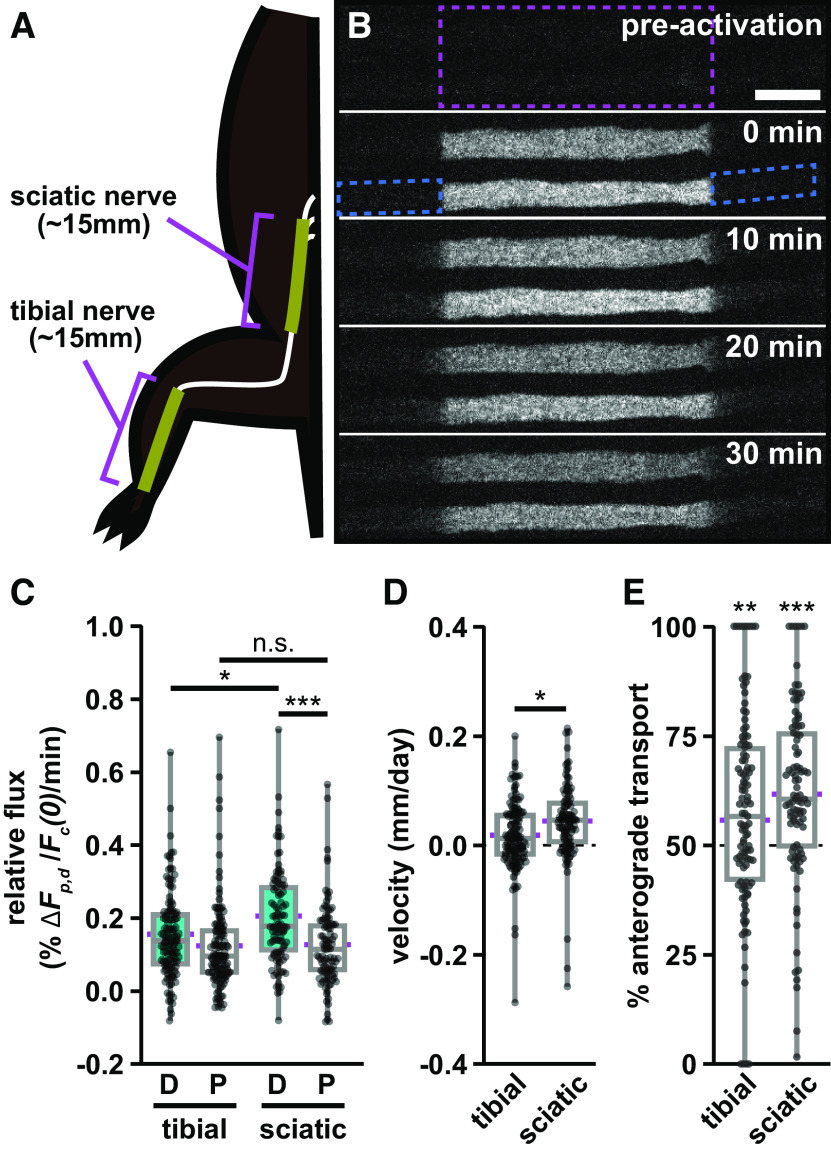
Figure 7.
Anterograde neurofilament flux is higher in proximal nerve segments. A, Diagram showing the relative location of the sciatic and tibial nerve segments in relation to the spine and hindlimb. B, Frames from a representative time-lapse image series of a pulse-spread experiment in the proximal sciatic nerve. The activated region is marked by the dashed magenta box, and the proximal and distal flanking regions are marked by the dashed blue boxes for one axon at t = 0 min. Note that there is some loss of fluorescence because of photobleaching in these raw images. Our quantitative analysis was confined to the first 4 min after activation, and the data were corrected for photobleaching (see Materials and Methods). Proximal is left, and distal is right. Scale bar, 10 μm. C, Quantification of the relative fluorescence flux in the distal (D) and proximal (P) flanking windows in the first 4 min following photoactivation (111 axons in 8 nerves for the tibial; 95 axons in 10 nerves for the sciatic). The tibial nerve data used for comparison is the 8-week-old male cohort shown in Figures 3 and 5. D, Neurofilament population transport velocity in the sciatic and tibial nerves (positive is anterograde; negative is retrograde). E, Percentage of neurofilament transport in the anterograde direction in the tibial and sciatic nerves. Significance in E is tested against a theoretical population with a mean of 50% and an equivalent SD. The boxes show the median, upper, and lower quartiles, and the whiskers show the minimum and maximum. The magenta points on either side of the boxes show the sample mean. The mean velocity and mean percentage anterograde were calculated using the average relative proximal and distal fluxes. n.s. p > 0.05, * p ≤ 0.05, ** p ≤ 0.01, *** p ≤ 0.001.

