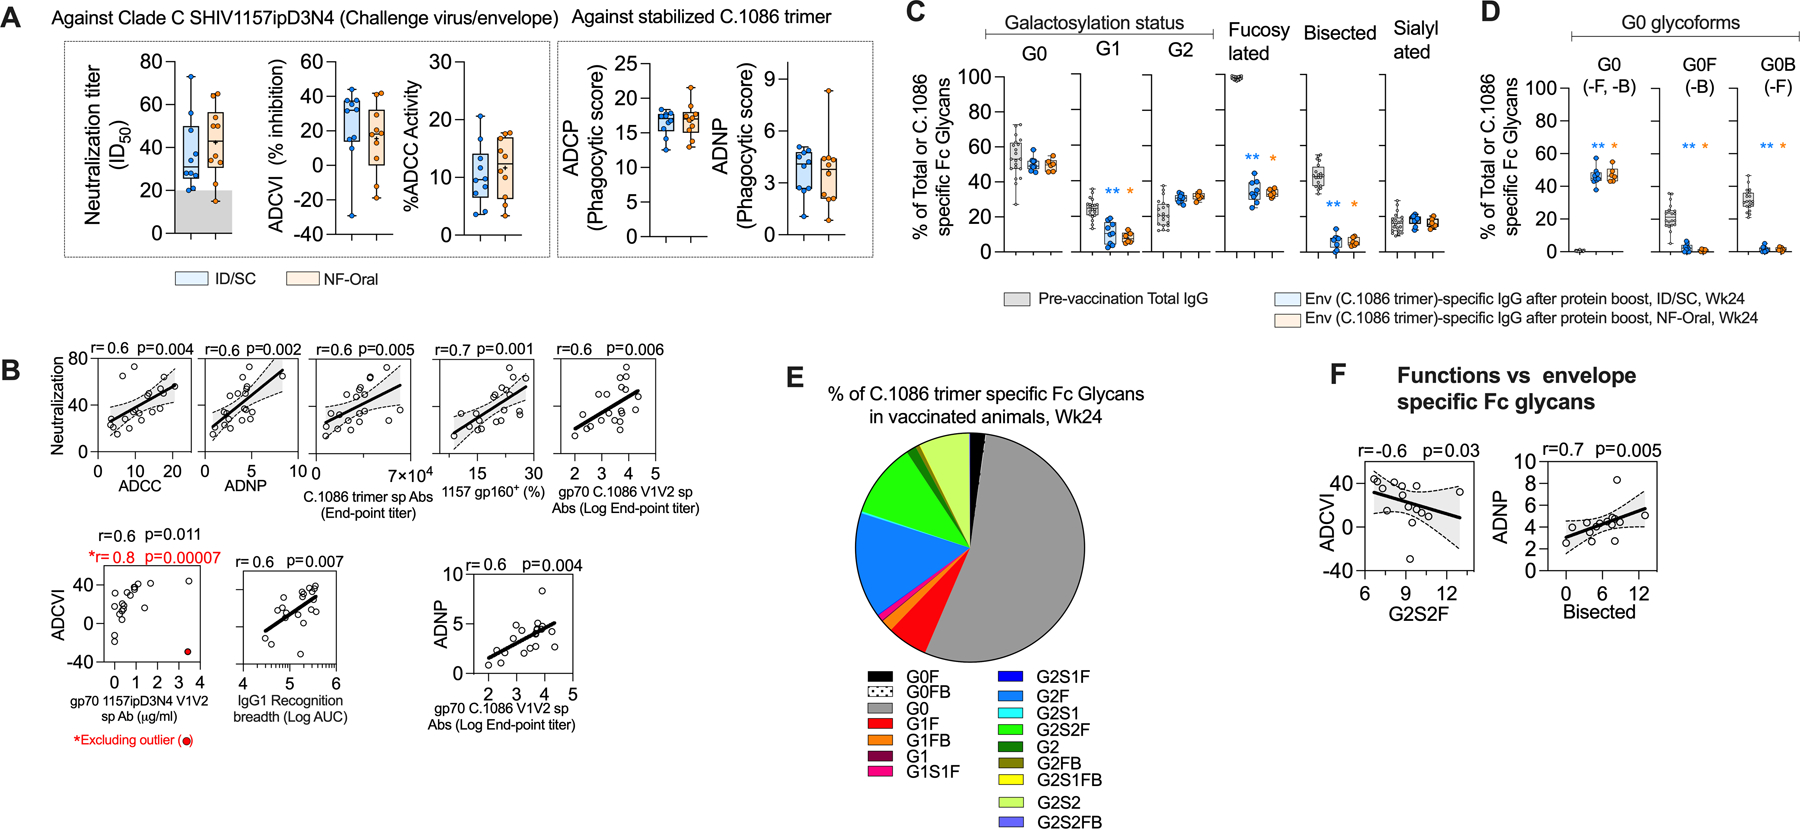
Fig. 3. Functional and biophysical characterization of serum antibody responses.

(A) Functional activities associated with the serum (collected two weeks after protein boost or week 24) from vaccinated animals, including neutralization, antibody-dependent cell-mediated virus inhibition (ADCVI), antibody-dependent cellular cytotoxicity (ADCC), antibody-dependent cellular phagocytosis (ADCP, monocyte mediated), antibody-dependent neutrophil phagocytosis (ADNP) activities. Neutralization was measured against SHIV 1157ipD3N4 Env G13.10 pseudotyped virus, ID50 serum dilution for 50% neutralization, titer< 20 (or background, shaded gray) shown at 15 for data representation. ADCVI and ADCC functions were measured against SHIV1157ipD3N4 (challenge virus envelope), while ADCP and ADNP activities were measured specific to C.1086 trimer. (B) Correlations between antigen-specific effector functions and antigen-specific antibodies in serum at Wk24. 95% confidence interval shaded gray. All significant findings are reported after adjusting for multiple comparisons by Bonferroni correction. Spearman’s correlation coefficient r and two-sided p value indicated, n=20. (C-E) Distribution of C.1086 trimer specific IgG Fc specific (C) total galactosylated (G0 agalactosylated, G1 mono-galactosylated, G2 di-galactosylated), total fucosylated, total bisecting GlcNAc and total sialylated glycoforms across the immunization groups; (D) all G0 bearing glycoforms; (E) all glycoforms monitored in the study (G0 agalactosylated, G1 mono-galactosylated, G2 di-galactosylated, F fucosylated, B bisecting GlcNAc, S1 mono-sialylated, S2 di-sialylated, nomenclature as described by Mahan et al., 2015 (80), responses from both groups (n=15) shown due to similar distribution profile of the glycoforms across the vaccination groups, see fig. S4D). In (C, D), total IgG Fc glycoform of pre-vaccination serum has also been shown in gray to indicate its baseline level, n=20. Wilcoxon matched-pairs signed rank two-tailed test for statistical comparison between two time-points within vaccinated groups i.e. Fc glycoform specific to total IgG sampled pre-vaccination and Fc glycoform related to Env-specific IgG sampled after protein boost, Wk24. Bonferroni correction used to adjust for multiple comparisons, significant findings were indicated by *p < 0.05, **p< 0.01, ***p<0.001, ****p<0.0001. p values group wise color coded and indicated above group specific data show comparison relative to group specific pre-vaccination data. (F) Relationship between different effector functions and Env-specific Fc glycoforms. 95% confidence interval shaded gray. Spearman’s correlation coefficient r and two-sided p value indicated, n=15. (C-F) All plots corresponding to Env-specific Fc glycoforms contain data from 15 vaccinated animals, serum collected at Wk24. Data was not available for 5 animals due to low concentration of Env-specific IgG in the serum samples. (A, C, D) All Responses measured in ID/SC group are colored blue, and NF-Oral group colored orange in all panels. Box and whiskers plots where box extend from 25th to 75th percentile, median indicated by line, minimum and maximum values indicated by whiskers. All values plotted are the average of at-least two independent experiments. ID/SC Intradermal/subcutaneous, NF-Oral Needle-free Oral vaccine groups. In all cases, data was monitored for n=10 animals in each vaccine arm, unless otherwise indicated.
