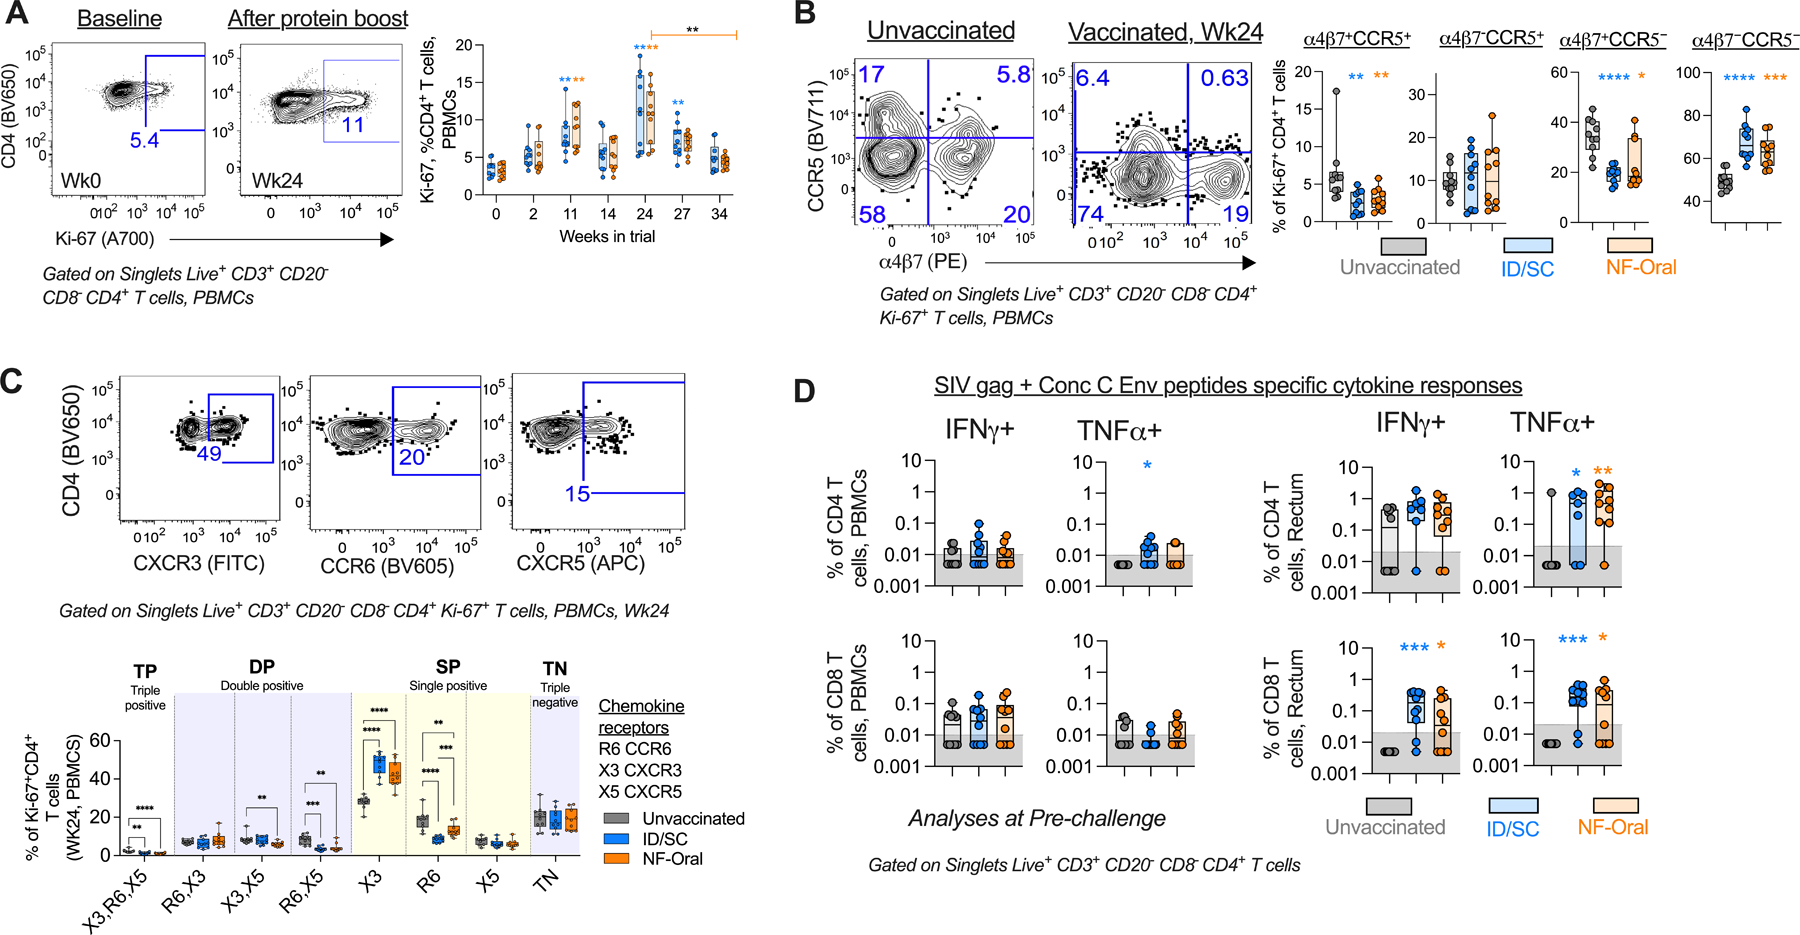
Fig. 4. Characterization of T cell responses after vaccination.

(A) Right, Temporal profile of circulating Ki-67+ CD4+ T cells (geomean in solid lines); Left, representative flow cytometry staining for a vaccinated animal. Wilcoxon matched-pairs signed rank test, two-tailed for statistical comparison within vaccinated groups. (B) Right, Scatter plot showing altered distribution of the fraction of circulating Ki-67+CD4+ T cells expressing α4β7/CCR5 chemokine receptors; important for permitting HIV-1 pathogenesis, at the peak proliferation phase of cells after vaccination (wk24) relative to unvaccinated control; Left, Representative flow staining. (C) Top, Representative flow staining showing gates used to monitor the co-expression of chemokine receptors on Ki-67+ CD4+ T cells and Bottom their comparative analyses using a Boolean function in FlowJo v9.9.6. One way ANOVA for statistical comparisons followed by Mann-Whitney U test for statistical comparison between groups. (D) Vaccine specific (SIV gag + Consensus C Env peptide pool) cytokine responses measured for CD4+ and CD8+ T cells present in blood and rectal tissue at pre-challenge (Wk34 or 4 weeks prior to intra-rectal SHIV challenge), n=10 in each vaccine arm and n=10 unvaccinated animals. For cytokine responses measured for rectal CD4+ T cells, n=7 ID/SC and n=9 NF-Oral due to data not available for animals with low CD4 T cell counts (<1000, threshold). Cells stimulated with PMA/Ionomycin and blank (non-stimulated) served as positive and negative controls respectively to define gates. Mann-Whitney U test for all statistical comparison between groups. All statistical analyses have been corrected for multiple comparisons using Bonferroni correction, except TNFα+ rectal CD4 T cell responses for ID/SC vs unvaccinated comparison. All comparisons found to be significant after correcting for multiple testing are indicated by *p < 0.05, **p< 0.01, ***p<0.001, ****p<0.0001. All Responses measured for ID/SC group indicated in blue, and NF-Oral group in orange. Box and whiskers plots where box extend from 25th to 75th percentile, median indicated by line, minimum and maximum values indicated by whiskers. (A) p values group wise color coded and indicated above group specific data indicate comparison relative to group specific pre-bleed response, or (B-D) responses measured relative to unvaccinated control animals, unless otherwise indicated. ID/SC Intradermal/subcutaneous, NF-Oral Needle-free Oral vaccine groups. In all cases, data was monitored for n=10 animals in each vaccine arm and n=10 unvaccinated animals, unless otherwise indicated.
