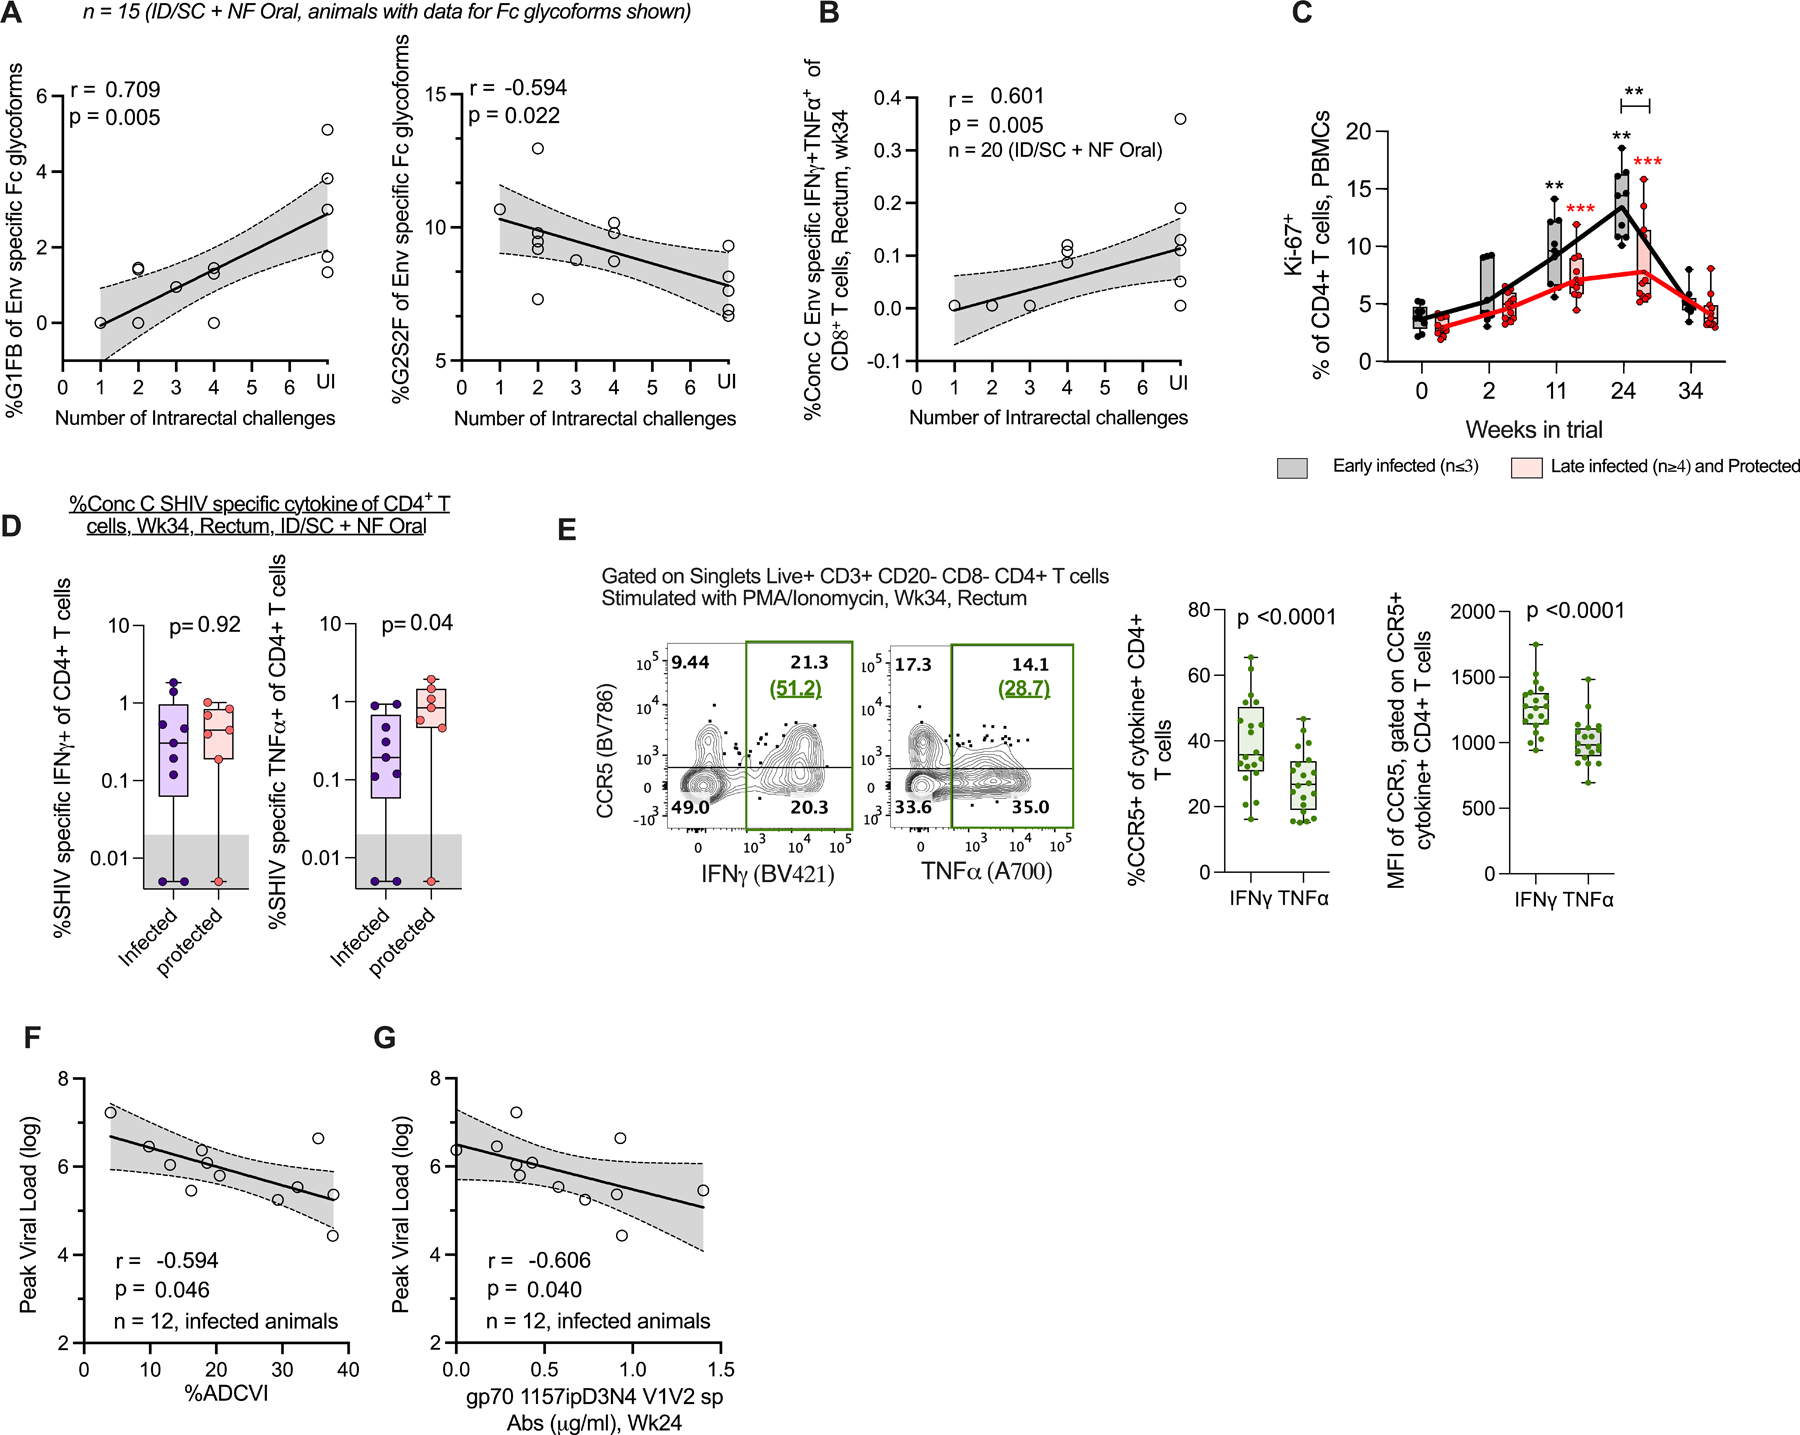
Fig. 6. Vaccine specific humoral and T cell responses are associated with protection and reduced viral replication after mucosal SHIV challenge.

(A) C.1086 trimer Env-specific IgG Fc glycoforms G1FB and G2S2F correlate with reduced and enhanced risk of SHIV infection, respectively. The plots contain data from n=15 vaccinated animals. Data was not available for 5 animals due to low concentration of Env-specific IgG in the serum samples. UI Uninfected. (B) Consensus C Env-specific IFNγ+TNFα+ CD8+ T cell responses measured at pre-challenge in rectum for all vaccinated animals (n=20, some data points overlap in the plot) associate with reduced risk of infection. UI Uninfected. (C) Kinetics of circulating Ki-67+ CD4+ T cells for vaccinated animals stratified into early infection acquirers (≤3 challenges, n=9) and late acquirers or protected (≥4 challenges or completely protected, n=11). Solid lines indicate geo-mean. Prior to vaccination or wk0, Peak effector response after MVA-1, MVA-2, protein boost i.e. WK2, Wk11 and Wk24, respectively, Pre-challenge wk34 or 4 weeks before virus exposure. Wilcoxon matched-pairs signed rank two-tailed test for statistical comparison within the groups, and Mann-Whitney U test for comparisons between groups. Comparisons found significant after correcting for multiple testing by Bonferroni correction indicated by *p < 0.05, **p< 0.01, ***p<0.001, ****p<0.0001. p values group wise color coded and indicated above group specific data indicate comparison relative to group specific pre-vaccination response, or otherwise indicated. (D) Protected vaccinated animals have (left) similar levels of Consensus C SHIV-specific IFNγ+, and (right) higher levels of TNFα+ CD4+ T cell responses at pre-challenge in rectum relative to infected vaccinees, Data for animals with rectal CD4 T cell counts > 1000 (threshold) shown, n=9 infected, n= 7 protected,. Unpaired two-tailed t-test for statistical comparison between groups. (E) CD4+ T cells in rectum producing TNFα after in-vitro stimulation with PMA/Ionomycin express significantly lower CCR5 (both as (middle) fraction and (right) mean fluorescence intensity per cell, MFI) relative to IFNγ+ producing CD4+ T cells, n=20 vaccinated animals. Wilcoxon matched-pairs signed rank test, two-tailed for statistical comparison between groups. Representative plot shown in left with %CCR5+ of cytokine+ CD4+ T cells indicated in green parenthesis. (F,G) Correlation between peak viral load and challenge virus-specific (F) ADCVI activity, (G) gp70 V1V2-antibodies for all infected vaccinated animals, n=12. In (A, B, F) Spearman’s correlation coefficient r and two-sided p-value indicated, 95% confidence band shaded gray. In (C-E) Box and whiskers plots where box extend from 25th to 75th percentile, median indicated by line, minimum and maximum values indicated by whiskers. P values reported in A, B, F, G are not adjusted for multiple comparisons. The un-adjusted and adjusted p-values for the immune parameters used to report correlations with protection and peak viral load are shown in table S3. ID/SC Intradermal/subcutaneous, NF-Oral Needle-free Oral vaccine groups.
