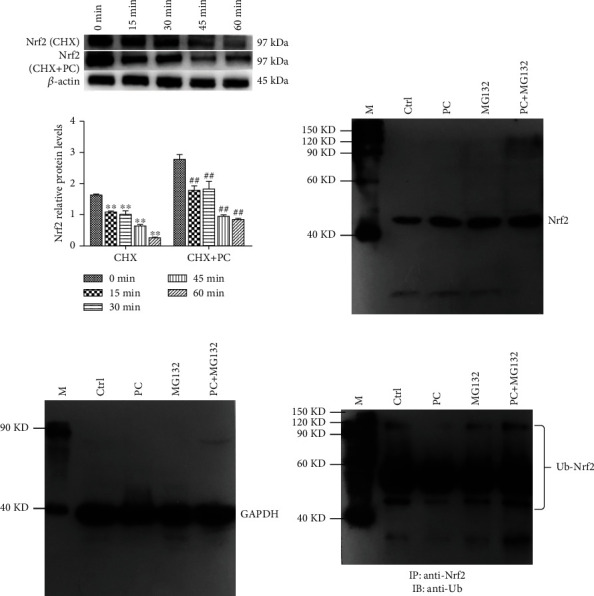
Figure 6.

PC-induced Nrf2 protein stability and ubiquitination in MOKE-K cells. (a) Intervention with 5 μg/mL PC for 0, 15, 30, 45, and 60 min and the control group for 24 h (100 μg/mL CHX for 1 h). All tests were repeated at least three times. (b–d) PC-induced Nrf2 relative protein levels in MODE-K cells. “M” is Easysee protein marker, “Ctrl” is the control group, and GAPDH is the internal control. “∗” represents P < 0.05 compared with the CHX control group, “∗∗” represents P < 0.01 compared with the CHX+PC control group. “#” represents P < 0.05 compared with the CHX control group, and “##” represents P < 0.01 compared with the CHX+PC control group.
