
Figure 8.
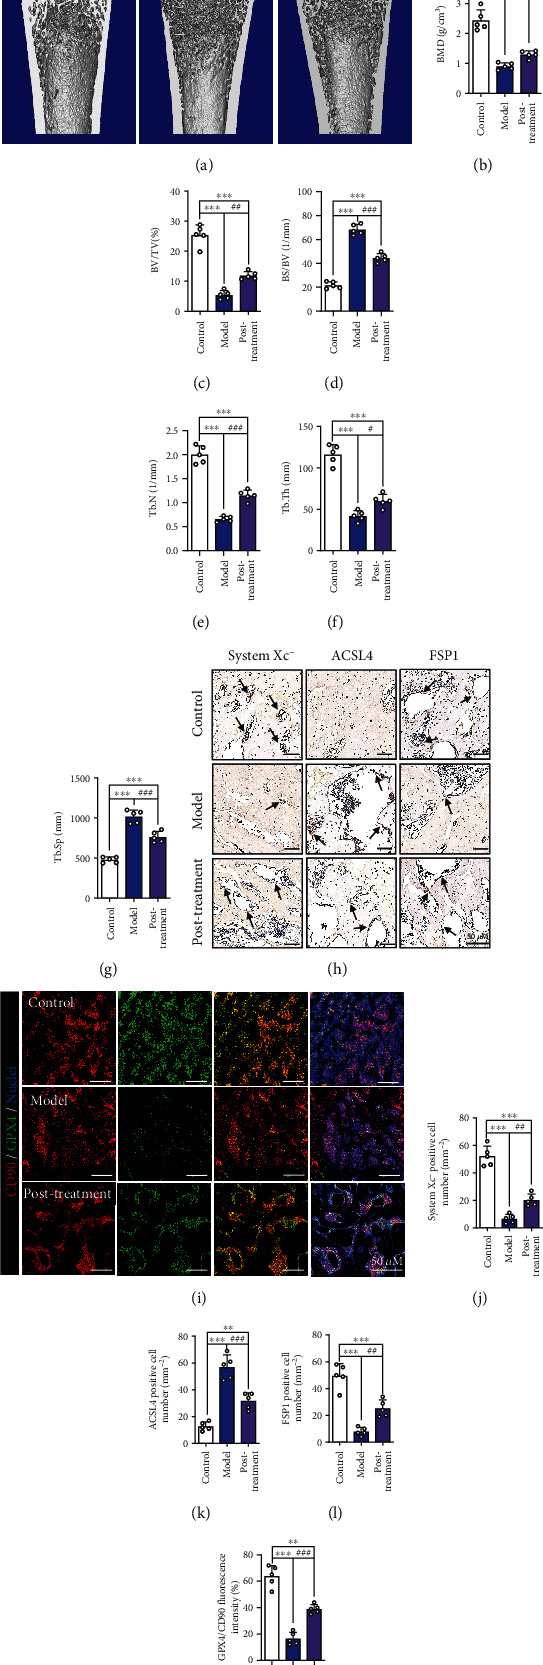
Even after DEX-induced ferroptotic effects begin, MT can still improve SIOP. (a) Images of micro-CT. (b) BMD (g/cm3). (c) BV/TV (%). (d) BS/BV (1/mm). (e) Tb.N (1/mm). (f) Tb.Th (mm). (g) Tb.Sp (mm). (h) IHC staining of system xc-, ACSL4, and FSP1, the IHC-positive cells were marked with black arrows. (i) Images of immunofluorescence double staining of CD90 and GPX4 in bone tissues. (j–l) Quantitative analysis of the number of the IHC-positive cells in (h). (m) Quantitative analysis of the area of GPX4/CD90-positive stains in (i). These studies were performed at least 3 biological replicates. Data represent mean ± SD (n = 5). ∗P < 0.05, ∗∗P < 0.01, ∗∗∗P < 0.005 compared with control group. #P < 0.05, ##P < 0.01, ###P < 0.005 compared with model group.