Figure 13.

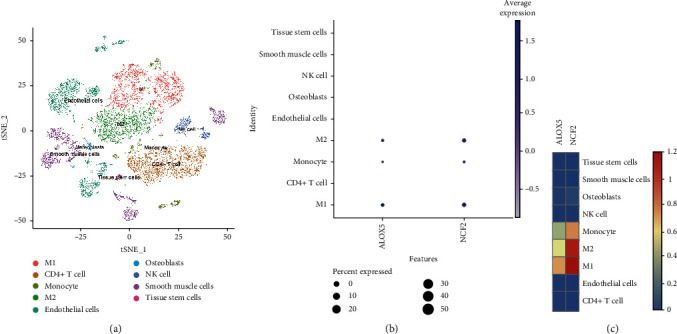
Single-cell analysis identified the expression of ALOX5 and NCF2. (a) Umap of nine cell types in GSE159677. (b and c) ALOX5 and NCF2 had high expression levels in monocyte and macrophages M1 and macrophages M2.

Single-cell analysis identified the expression of ALOX5 and NCF2. (a) Umap of nine cell types in GSE159677. (b and c) ALOX5 and NCF2 had high expression levels in monocyte and macrophages M1 and macrophages M2.