Figure 2.

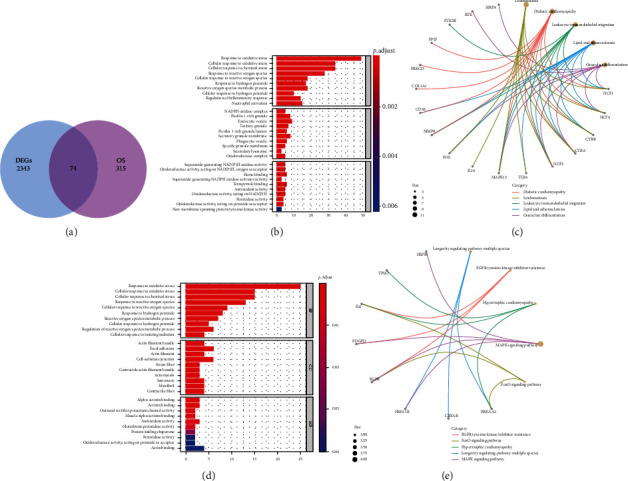
Identification of DEOSGs. (a) Venn diagrams of the DEGs and OS-related genes. (a and b) GO and KEGG analysis of upregulated DEGs. (c and d) GO and KEGG analyses of downregulated DEGs.

Identification of DEOSGs. (a) Venn diagrams of the DEGs and OS-related genes. (a and b) GO and KEGG analysis of upregulated DEGs. (c and d) GO and KEGG analyses of downregulated DEGs.