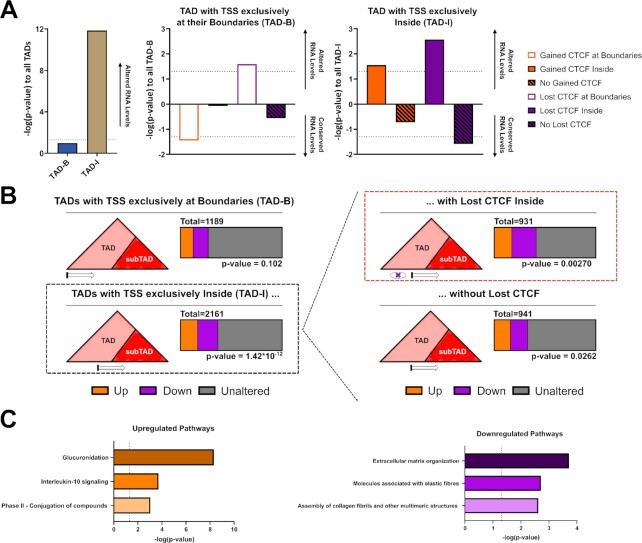
Figure 6.
Loss of CTCF binding within TADs drives oncogenic transcription. (A, B) Impact on the distribution of altered genes TSS (DESEQ2, FDR < 0.05) and altered CBS (csaw, FDR < 0.05) in the context of TAD on the enrichment of strongly altered genes (ZF1M/ZF1M to CTL abs(log2FC) ≥ 1). Showing the most significant impact of the lost of CTCF at TADs encompassing genes within them (TAD-I), compared to gain of CTCF or at TAD encompassing genes at their boundaries only (TAD-B) (P-value were generated from chi-square test on distribution of altered genes, −log(P-values) depicting significantly less strongly altered genes were turned negative in (A) to ease comprehensiveness of the graph). (C) Top 3 pathway, sorted by P-value, of Reactome Pathway Enrichment Analysis of strongly upregulated and downregulated genes from the distribution highlighted in red in (B). Showing that lost of CTCF within TAD is driving the major changes in gene expression observed in global GSEA analysis of the RNA-Seq.

