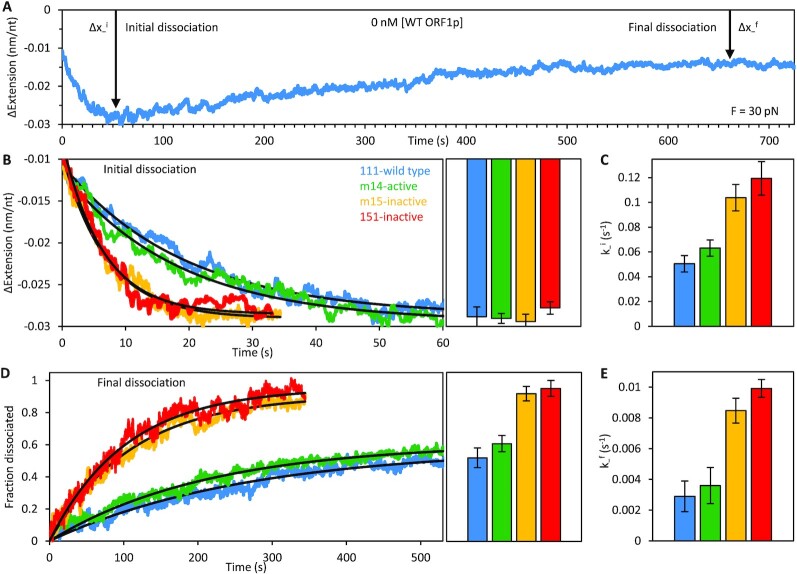
Figure 5.
Dissociation phases of active (111p, m14) and inactive (151p, m15) trimers at 30 pN. (A) Representative 111p dissociation curve showing two phases of dissociation at 30 pN: an initial re-compaction (Δx−i) followed by ssDNA elongation (Δx−f). (B) All ORF1p trimers eventually compact the DNA to the same extent during the initial dissociation phase. Bar graphs show the average amplitude of compaction from multiple (n ≥ 3) experiments with each variant. However, re-compaction of the ssDNA occurs approximately twice as fast with the inactive variants as it does with the active proteins (C). Final dissociation of the inactive ORF1 proteins is both more complete (D) and faster (E) than the active trimers. In contrast, the ssDNA binding dynamics of all three ORF1p variants (m14, m15 and 151p) are identical to those of the wild type at 30 pN (shown in Figure 4).

